
Fig. 2.
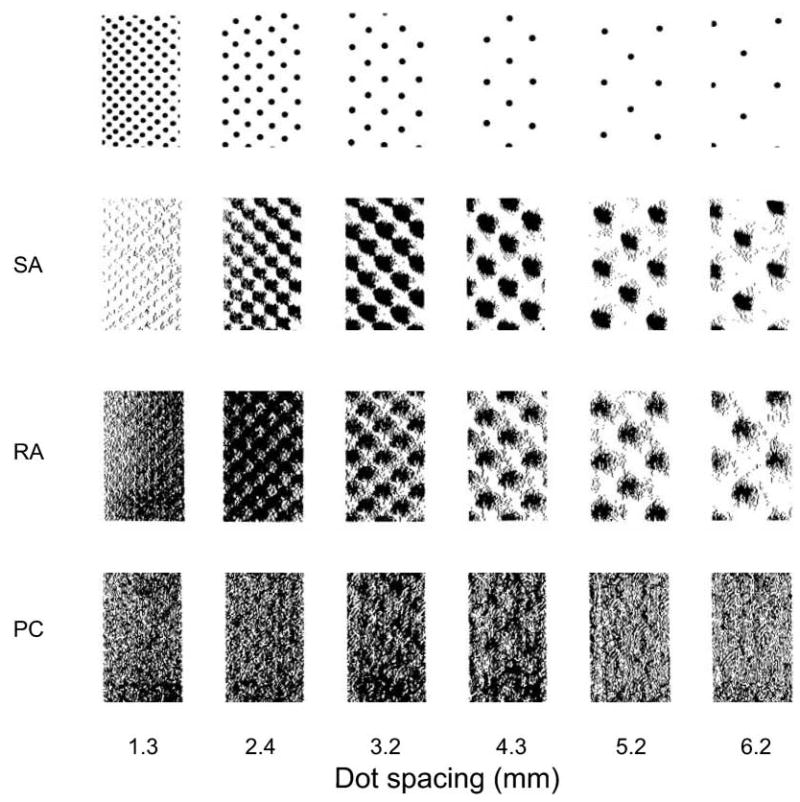
Responses of single, typical slowly adapting type 1 (SA1) afferents, rapidly adapting cutaneous (RA) afferents, and Pacinian (PC) afferents to six raised-dot surfaces with 0.5 mm dot diameters. The dot patterns were scanned repeatedly from right to left over the afferent fibers’ receptive fields (in effect, the receptive fields scanned from left to right) at 20 mm/s. Each tick mark represents the occurrence of an action potential. After each scan, the dot pattern was shifted 0.2 mm at right angles to the scanning direction. Each receptive field was on a distal fingerpad. Each cluster of action potentials in the right-hand rasters (6.2 mm dot spacing) of the SA1 and RA responses is, in effect, a receptive field plot. Note that although the SA1 and RA responses to the widely separated dots are similar, the SA1 afferent resolves the closely spaced dots much more effectively than does the RA afferent. This PC afferent (and all PC afferents) responds as intensely to the surface with 1.3 mm spacing (which feels quite smooth) as it does to the surface with 3.2 mm spacing (which feels very rough—about as rough as 36-grit sandpaper). Adapted from Connor and others (1990).