
Fig. 4.
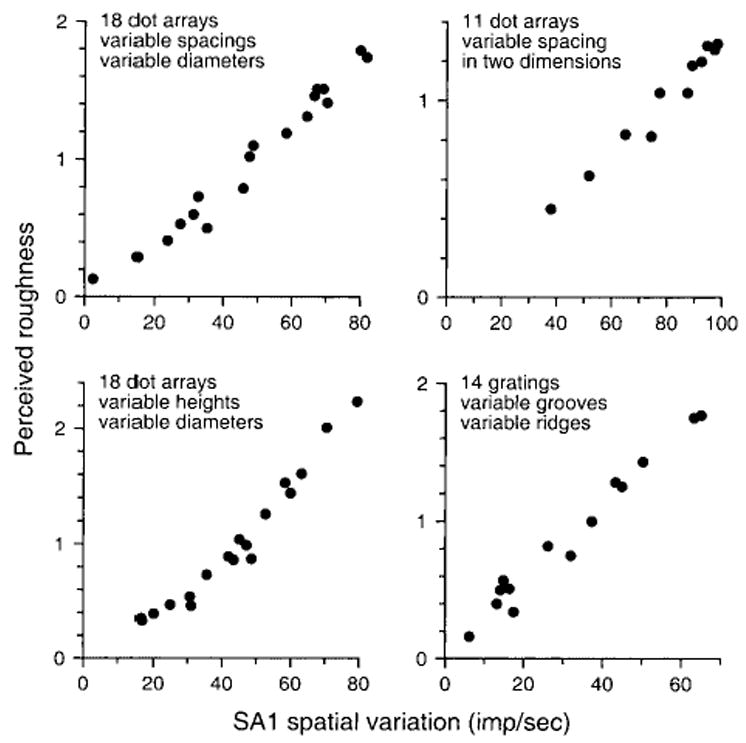
Consistency plots of slowly adapting type 1 (SA1) spatial variation versus subjective roughness from four studies with different stimulus patterns. The ordinate in each graph is the mean subjective report across all subjects in a single study. The abscissa is the mean absolute difference in firing rates between SA1 afferent fibers with receptive field centers separated by about 2 mm. Each dot represents the data from a single surface in the study. The data in the top left graph are from the study by Connor and others (1990), illustrated in Figures 1 to 3. The data in the top right graph are from the study by Connor and Johnson (1992), which was designed to distinguish between temporal and spatial neural codes. The data in the bottom left graph are from the study by Blake and others (1997a), which was designed to distinguish between neural codes based on SA1 and rapidly adapting (RA) responses. The data in the bottom right graph are from the study by Yoshioka and others (2001), which was designed to determine whether SA1 spatial variation could account for roughness perception when the feature separations are less than 1 mm. The product-moment correlation coefficient is 0.97 or greater in each graph.