
Fig. 5.
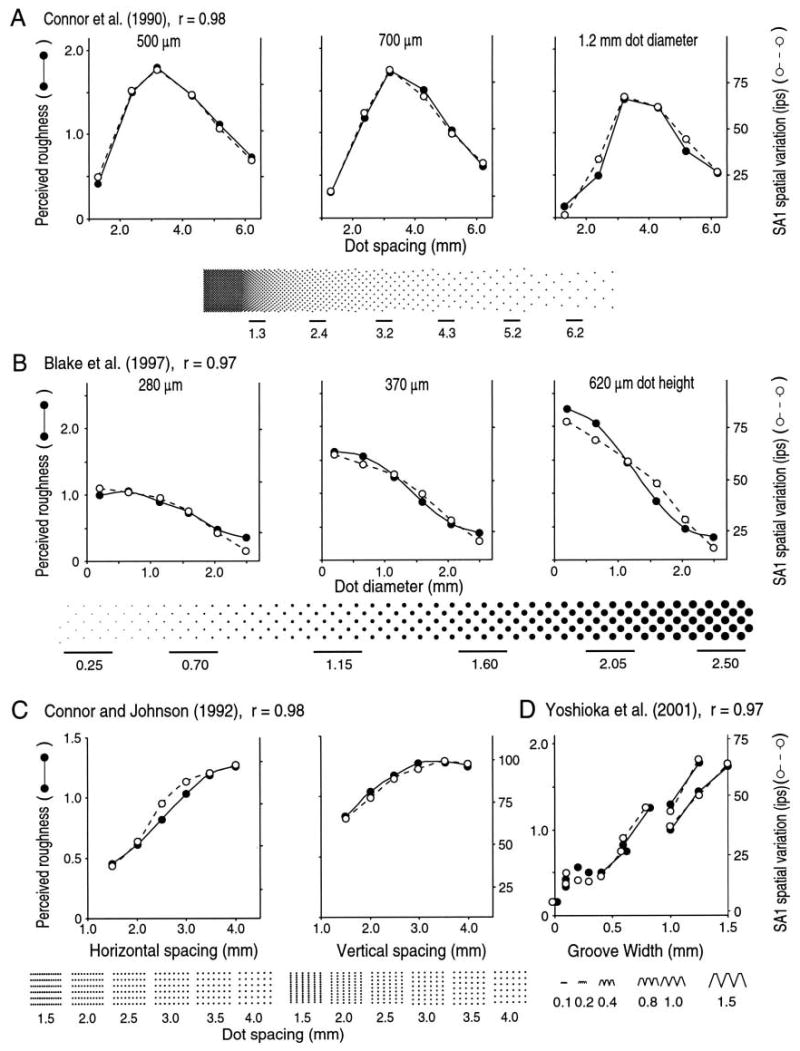
Roughness magnitude and spatial variation in slowly adapting type 1 (SAI) firing rates from four studies (see text). The left ordinate and filled circles in each graph represent mean roughness judgments for individual surfaces. The right ordinate and open circles represent spatial variation in SA1 impulse rates evoked by the same surfaces. The top row illustrates data from a study employing raised-dot patterns in which dot spacing and dot diameter were varied independently (Connor and others 1990). The middle row shows data from a study in which dot diameter and dot height were varied widely (Blake and others 1997b). The two left graphs, bottom row, show data from a study in which the horizontal dot spacing (i.e., dot spacing in the scanning direction) and vertical dot spacing (i.e., dot spacing orthogonal to the scanning direction) were varied independently (Connor and Johnson 1992). The right graph shows data from a study using scanned gratings in which the grating period ranged from 0.1 to 2.0 mm (Yoshioka and others 2001). The correlation between roughness judgments and this putative neural code was 0.97 or greater in all studies. Adapted from Yoshioka and others (2001).