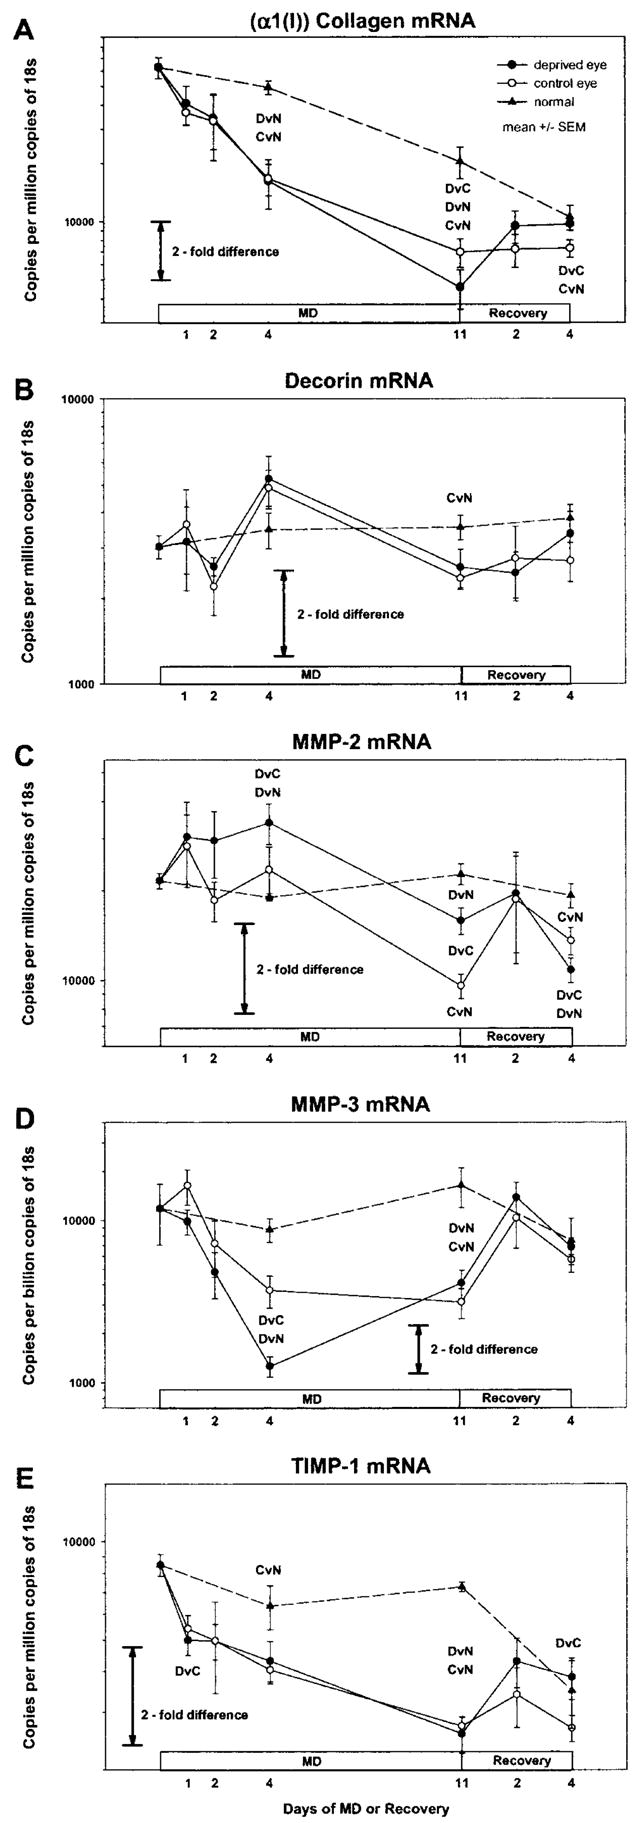
Figure 3.

mRNA levels in the deprived and control eyes of animals in groups with different durations of MD or MD/recovery. Dashed lines: data from normal animals (left and right eye averaged). (A) Type I collagen (α1 chain), (B) decorin core protein, (C) MMP-2, (D) MMP-3, and (E) TIMP-1. All mRNA levels are expressed as copies per million copies of 18s, except for MMP-3 levels, which are copies per billion copies of 18s. Error bars are SEM. DvC, deprived eyes different from control eyes (paired-test, P < 0.05); DvN, deprived eyes different from normal eyes, (ANOVA, LSD, P < 0.05); CvN, control eyes different from normal eyes (ANOVA, LSD, P < 0.05). Deprived or control eye data could be compared statistically to normal eye data only at the four points at which age-matched normal data were available.
