
Figure 1. Genome-Wide Promoter Analysis Reveals the Association of LSD1 with a Broad Gene Activation Program.
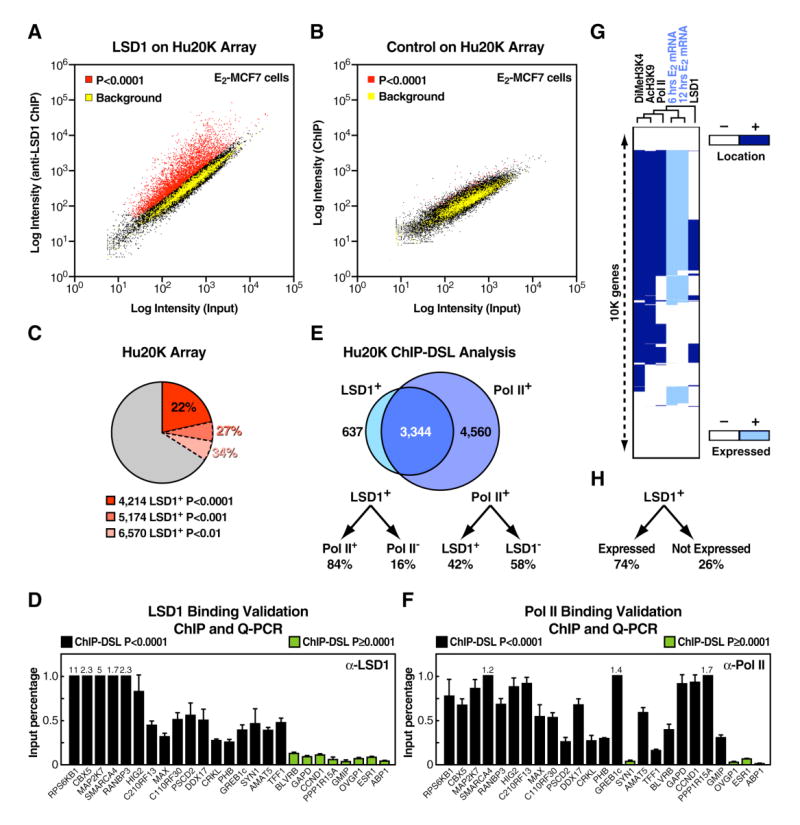
(A) Scatter plot of LSD1 recruitment to human gene promoters is shown. E2-induced MCF7 cells were profiled on the Hu20K array by ChIP-DSL. Three biological replicates were used to derive enriched promoters at p<0.0001 (red), shown in comparison with intergenic genomic sequences as negative controls (yellow). Weighted average is visualized on a single experiment scatter plot. (B) Scatter plot of a non relevant antibody profiled on the Hu20K array by ChIP-DSL is shown. Two biological replicates were used. (C) Number and percentage of LSD1+ promoters on the Hu20K array at different statistical cutoffs are shown. (D) ChIP/qPCR analysis of 17 LSD1+ and 8 LSD1− randomly selected promoters in E2-stimulated MCF7 cells is shown. The data are the average of three replicates, and error bars represent ± standard error mean. (E) Venn diagram of LSD1+ and Pol II+ promoters obtained by ChIP-DSL is shown. Only promoters with reliable signal intensities in both profiling experiments were included in the comparison. (F) ChIP/qPCR analysis of Pol II recruitment on selected LSD1+ and LSD1− promoters in E2-stimulated MCF7 cells is shown. The data are the average of three replicates, and error bars represent ± standard error mean. (G) Correlation of gene expression (light blue) with promoter occupancy (dark blue) is shown and includes histone modification marks (DiMeH3K4 and AcH3K9) as well as Pol II and LSD1, which were profiled in E2-induced MCF7 cells. Only genes included in both promoter- and expression-profiling arrays and reliably scored in all measurements were used to construct the binary map by unsupervised hierarchical clustering analysis. (H) LSD1+ genes classified by mRNA expression status are shown.