
Figure 3.
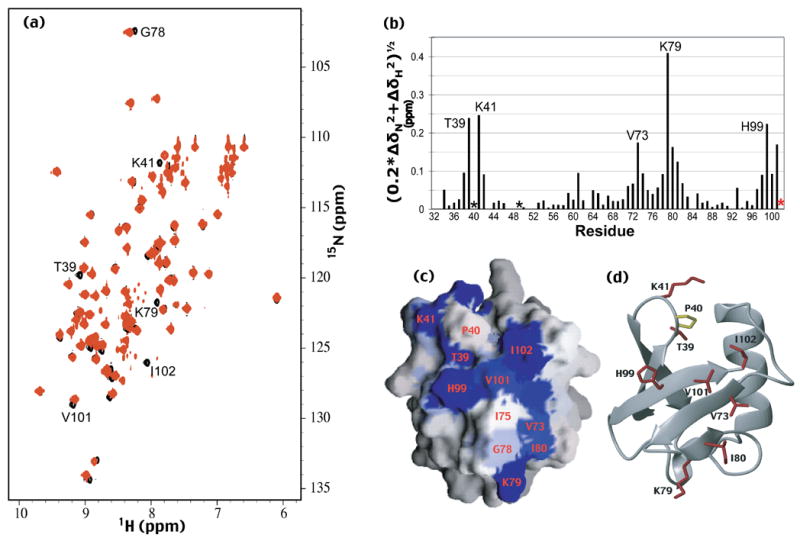
The surface of hPLIC2’s UBL domain that interacts with hHR23a is revealed. (a) [1H,15N] HSQC spectra of hPLIC2 (26-103) alone (black) and with equimolar quantities of hHR23a (red). Selected shifted or broadened resonances of hPLIC2’s UBL domain are labeled. (b) Chemical shift perturbation data for hPLIC2’s UBL domain caused by hHR23a addition. The data were treated according to equation 1. I102, whose resonance disappeared upon hHR23a addition, is indicated by a red star, whereas P40 and P49, which are excluded from this analysis, are indicated with black stars. (c and d) The surface of hPLIC2 UBL domain that binds hHR23a has been identified. GRASP 33 and MOLMOL 34 were used to generate panels (c) and (d) respectively. P40, which lacks an amide proton, is labeled in panel (c) and colored yellow in panel (d). The reported UBL domain coordinates for hPLIC2 11 were used to generate this figure. The surface not shown, namely that rotated by 180° relative to that shown in (a) contains no perturbed residues, and is provided as Supplementary Figure 2(b).