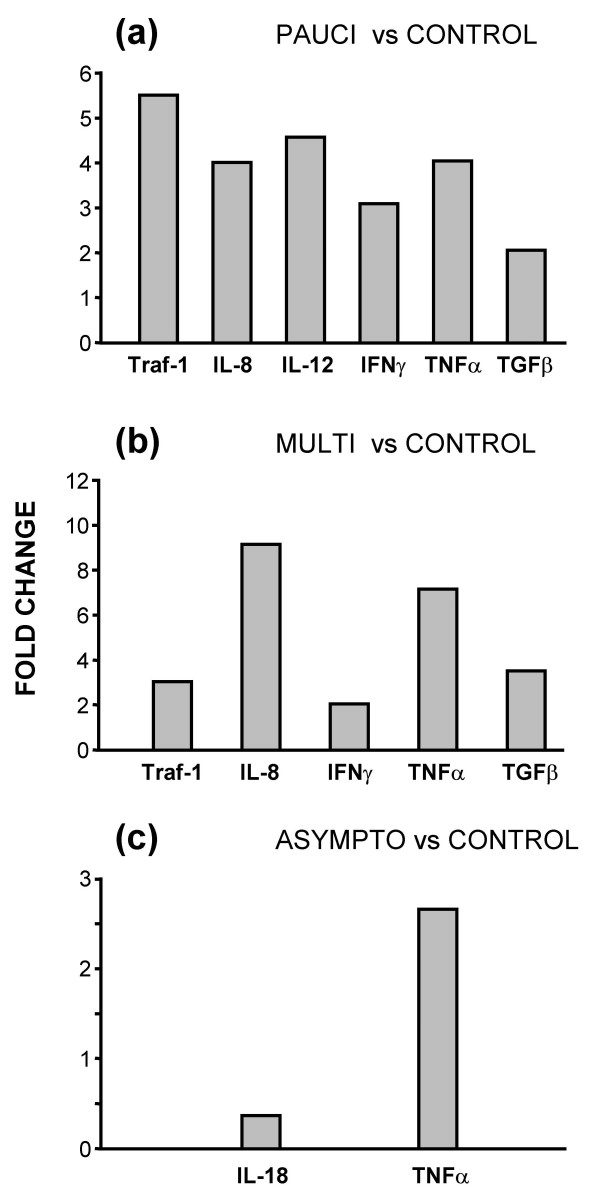
Figure 5.
Statistically significant changes in genes between the three IS900+ groups and the uninfected control group. (a) Comparison of paucibacillary and control; (b) comparison of multibacillary and control; (c) comparison of asymptomatic and control. Results are given as significant (p ≤ 0.05) fold-changes of mean copy-numbers relative to the mean copy-numbers of the comparative group.

