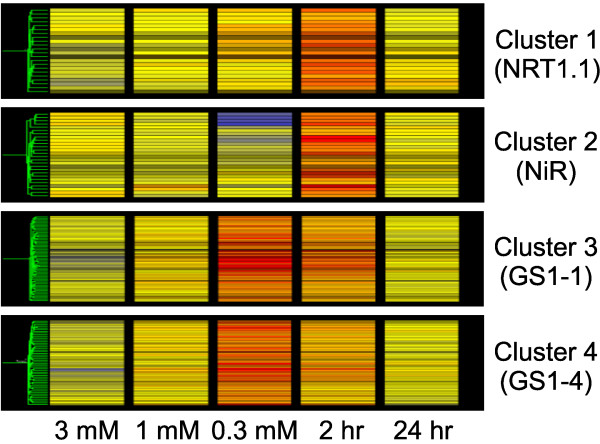
Figure 2.
Expression patterns of genes in each cluster. Relative expression levels of genes in each cluster were presented. The warmer the colors are, the higher the expression levels are. 3 mM = the sufficient-N condition; 1 mM = the limiting-N condition; 0.3 mM = the stress-N condition; 2 hr = 2 hr induction; 24 hr = 24 hr induction. Each line represents one gene and the gene list is provided in Additional file 7.

