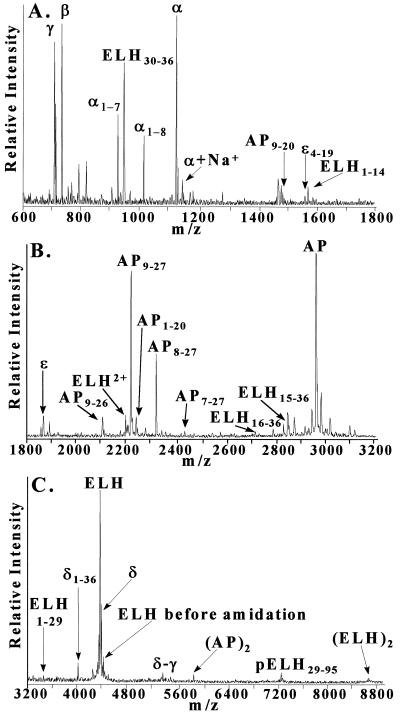
Figure 2.
Representative mass spectrum of a single bag cell. The mass scale is divided into (A) low, (B) middle, and (C) high m/z regions. Mass assignment for each peak is based on internal calibration with α-BCP and ELH. Peaks generally correspond to [M+H]+, where M is the molecular weight of each peptide. Note that in A, the [M+Na]+ peak for α-BCP is indicated; in B, ELH2+ is the [M+2H]2+ peak for ELH; and in C (AP)2 and (ELH)2 are the [2M+H]+ peaks for AP and ELH, respectively. δ-γ is a processing intermediate.

