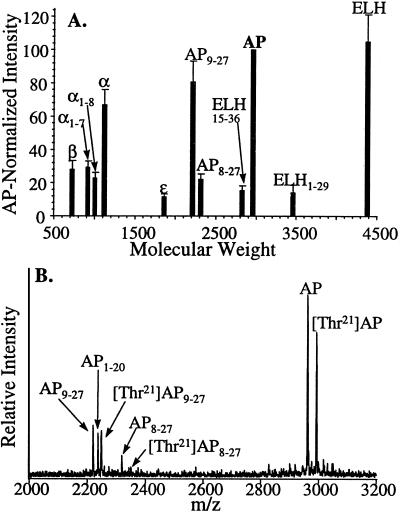
Figure 3.
(A) A composite mass spectrum of bag cells from 34 different animals. For each mass spectrum, the peaks were normalized (IntensityAP = 100). Errors are given as the SEM. (B) Representative mass spectrum of the AP region from an animal expressing a [Thr21]AP variation. Both wild-type and variant AP-related peptides are seen. The absence of two peaks for AP1–20 is evidence that the amino acid substitution is in the residues 21–27, whereas the mass difference between each wild-type/variant pair enables the substituted residue to be identified.

