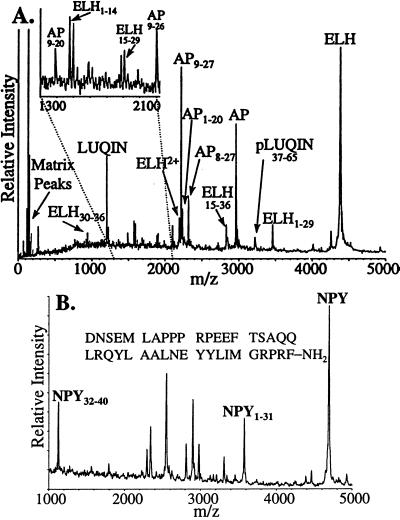
Figure 4.
(A) A mass spectrum of an individual L3 neuron (identified on the basis of position, size, and color) with the major peptide peaks identified. Baseline analysis revealed no peptide peaks corresponding to N-terminal peptides of pELH. (Inset) An expanded mass scale for the region between the dotted lines. (B) Aplysia NPY is one of the peptides identified in a single cell from the abdominal RG cluster.

