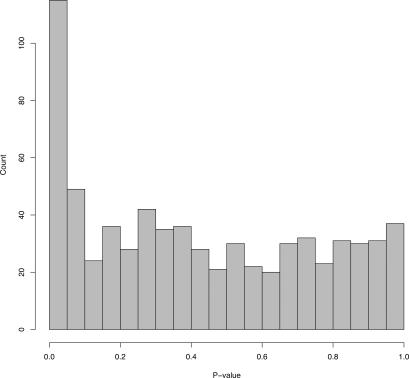
Figure 5. Null p-Values under Heterogeneity.
A histogram of the null p-values from a single simulated experiment affected by heterogeneity. The distribution of these p-values appears identical to a complete set of p-values from an experiment that is not subject to heterogeneity. Therefore, it is not possible to identify and account for heterogeneity by analyzing one-dimensional p-values or test-statistics (see also Text S1).

