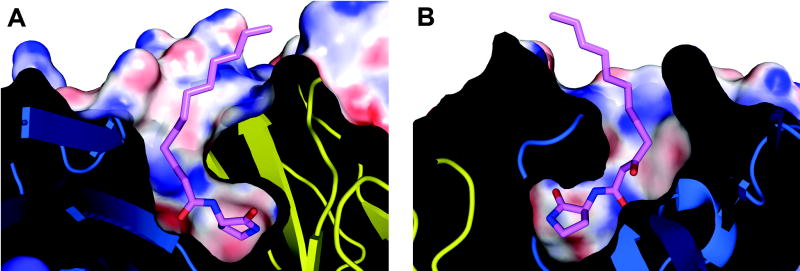
Figure 4.
High electrostatic and shape complementarity of the hapten analog in the antibody-combining site. A slice through the center of the binding site is shown. (a) and (b) correspond to the front and back view. The electrostatic potential was calculated in APBS 64 and mapped onto the surface with the color code ranging from -30 kT/e (bright red) to +30 kT/e (dark blue).

