Fig. 1.
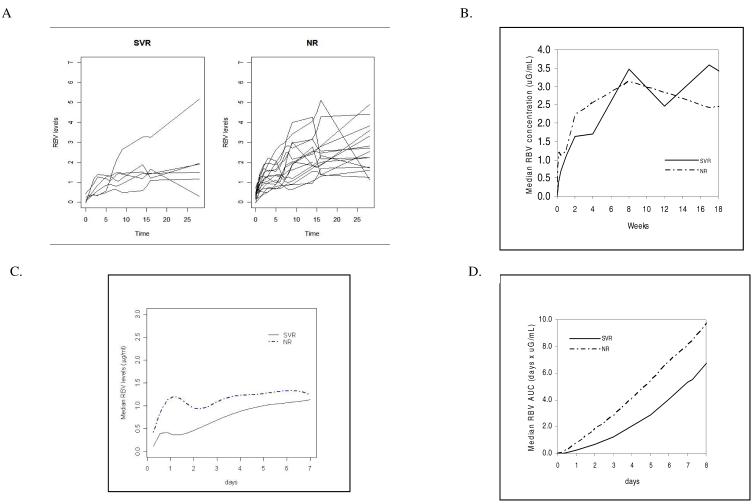
A) Plasma ribavirin levels during the first 28 days of treatment for individual patients stratified according to treatment outcome, sustained virological responders (SVRs) and nonresponders (NRs). B) Differences in median ribavirin (RBV) concentration in plasma during the first 18 weeks of treatment in SVRs and NRs. C) Cubic spline fit of median RBV levels during the first week for SVRs and NRs. An exact cubic spline was fit using the R spline function according to the Forsythe, Malcolm, and Moler method [35]. D) Differences in median RBV area under the curve during the first 8 days of treatment between SVRs and NRs. RBV area under the curve was significantly lower in SVRs compared with NRs for the first 28 days of treatment (p<0.01).

