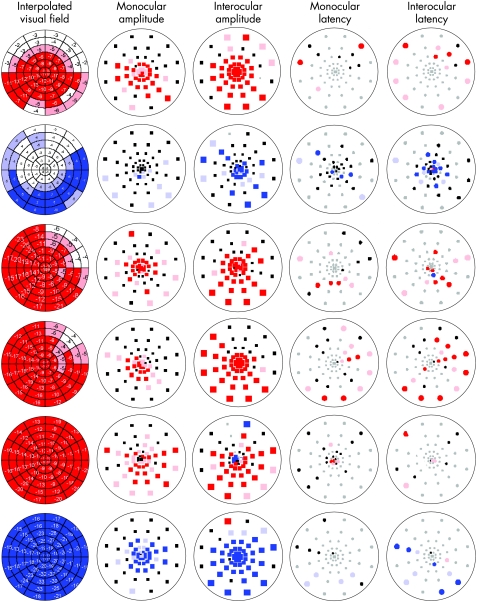
Figure 1 Multifocal visual evoked potential (mfVEP) data. Interpolated visual fields: estimated visual loss in decibels in 60 mfVEP sectors. Monocular and interocular amplitude plots: black squares indicate that there was no significant difference between the amplitude of the affected eye and normal eyes (monocular) or between the two patient's eyes (interocular), the coloured squares (right eye, blue and left eye, red) indicate that there were significant differences between the affected eye and normal eyes (monocular) or between the patient's eyes (interocular) either at p<0.5 (desaturated colour ) or p<0.1 (saturated colour) level. Grey squares indicate a signal‐to‐noise ratio <1.7. Monocular and interocular latency plots: black ovals indicate that there were no significant differences between the latency of the affected eye and normal eyes (monocular) or between the two patient's eyes (interocular), the coloured squares (right eye, blue and left eye, red) indicate that there were significant differences between the latency of the affected eye and normal eyes (monocular) or between the patient's eyes (interocular) either at p<0.5 (desaturated colour ) or p<0.1 (saturated colour) level. Grey ovals indicate a logarithm signal‐to‐noise ratio <0.23.

An official website of the United States government
Here's how you know
Official websites use .gov
A
.gov website belongs to an official
government organization in the United States.
Secure .gov websites use HTTPS
A lock (
) or https:// means you've safely
connected to the .gov website. Share sensitive
information only on official, secure websites.
