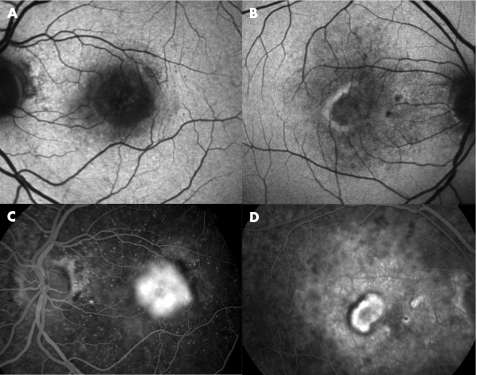
Figure 1 Fundus autofluorescence images (A,B) and corresponding fundus fluorescein angiograms (FFAs; (C,D) of two eyes with classic choroidal neovascularisation (CNV). A low autofluorescence signal is observed at site of CNV on autofluorescence images (A). A thin “halo” of increased autofluorescence surrounding the CNV is also seen (B) which corresponded to a thin area of blocked fluorescence on FFA (D).

An official website of the United States government
Here's how you know
Official websites use .gov
A
.gov website belongs to an official
government organization in the United States.
Secure .gov websites use HTTPS
A lock (
) or https:// means you've safely
connected to the .gov website. Share sensitive
information only on official, secure websites.
