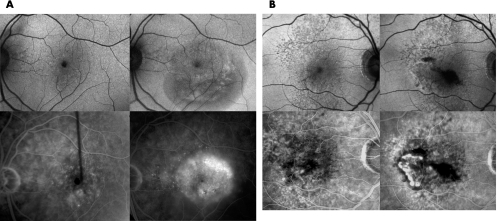
Figure 3 Fundus autofluorescence images (A,B top) and corresponding fundus fluorescein angiograms (FFAs; A,B bottom) of two eyes before (A,B left) and after (A,B right) the development of choroidal neovascularisation (CNV). Patient 1 (A): In November 2004, although a small area of blocked fluorescence was observed on FFA, which corresponded to a small retinal haemorrhage, no CNV was detected (A bottom, left). Fundus autofluorescence images at this time showed no major abnormalities (A top, left). After 3 months, an occult CNV developed (A bottom, right) and an irregular area of low autofluorescence signal was observed at the site of the CNV (A top, right). Patient 2 (B): Areas of increased fluorescence, corresponding to small window defects were observed on FFA, but no CNV was detected in November 2004 (B bottom, left). Fundus autofluorescence images at this time showed small foci of decreased autofluorescence signals (B top, left). After 5 months, a classic CNV developed (B bottom, right) and associated subretinal blood was observed. An irregular area of low autofluorescence signal was observed at the site of the CNV (B top, right) and a low autofluorescence signal corresponded to the subretinal blood.

An official website of the United States government
Here's how you know
Official websites use .gov
A
.gov website belongs to an official
government organization in the United States.
Secure .gov websites use HTTPS
A lock (
) or https:// means you've safely
connected to the .gov website. Share sensitive
information only on official, secure websites.
