
Figure 6.
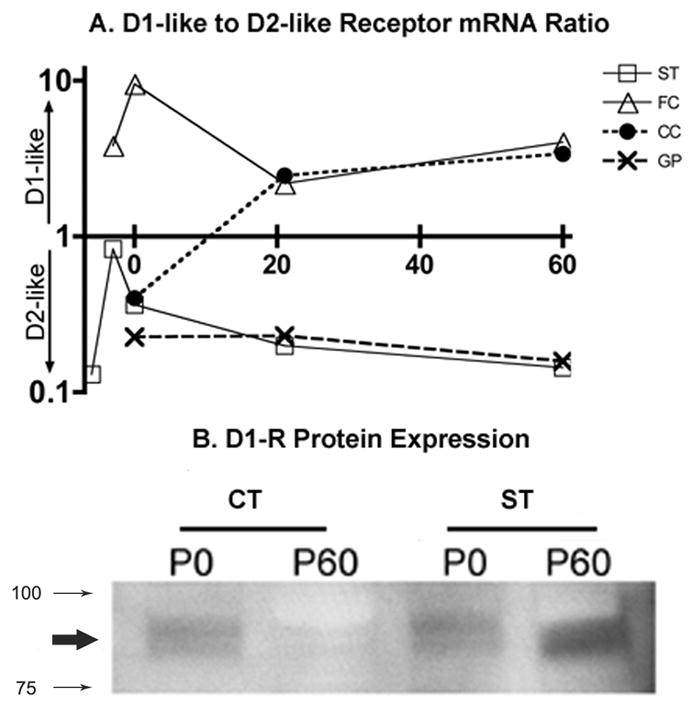
An overview of the ratio between D1-like receptors (summation of D1R and D5R) and D2-like receptors (summation of D2R, D3R and D4R) is shown for each region during development (A; age along the abscissa; 0, 21 and 60 = P0, P21 and P60, respectively). Only the striatum at E15 approximates equipoise (ratio 0.8) between the two dopamine receptor classes. The ventral forebrain represented by the striatum (ST) and globus pallidus (GP) show D2-like dominance in receptor expression, whereas the dorsal forebrain represented by frontal (FC) and cingulate (CC) cortex show D1-like dominance. An immunoblot showing D1R protein expression (B). Membrane fractions from postnatal days 0 and 60 (P0 and P60, respectively) cortex and striatum were analyzed for D1R protein expression. The D1R band (bold arrow) appears between ~ 100 and 75 KD (smaller arrows). The highest levels of protein are seen in the adult striatum and the lowest levels in the adult cortex with intermediate levels at P0 in the cortex and striatum.