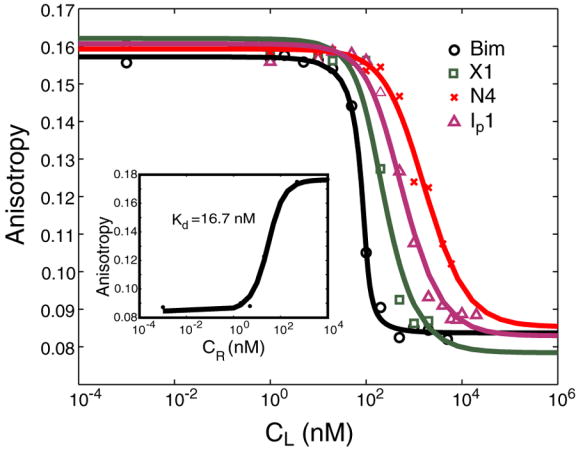
Figure 9.

Competition binding curves from fluorescence polarization assay. The assay was done at room temperature with murine Bcl-xL at 100 nM and FITC-Bad at 25 nM. Competing peptides MBM, X1, N4 and Ip1 are shown in black, green, red and purple, respectively. The lines are binding curves fit to the data points. CL is the initial concentration of the competitor peptide. The inset shows the direct binding of FITC-Bad to murine Bcl-xL (Kd = 16.7 nM). Here CR is the initial concentration of Bcl-xL. The Kd values of the competing peptides (MBM, X1, N4, and Ip1) were derived using our measured Kd (Bad/Bcl-xL). Competition binding measurements were done in duplicate and gave the following ranges of Kd values: Kd(Bim)=0.1–0.8 nM, Kd(X1)=9.4–22.4 nM, Kd(N4)=233.1–239.7 nM, Kd(Ip1)=47.7–73.8 nM.
