
Figure 3.
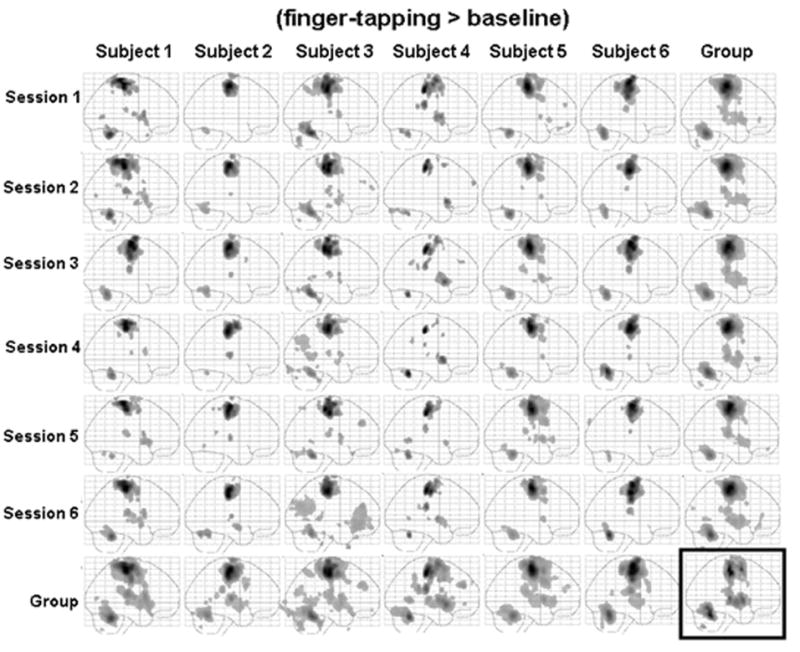
Sagittal maximum intensity projections (MIPs) for the finger-tapping task in both individual session and group analysis. The subject average for all 36 sessions is shown in the box at the bottom right. The group averages across all six sessions for each subject are shown along the bottom row. The group averages across the 6 subjects in each session are shown in the far right column.