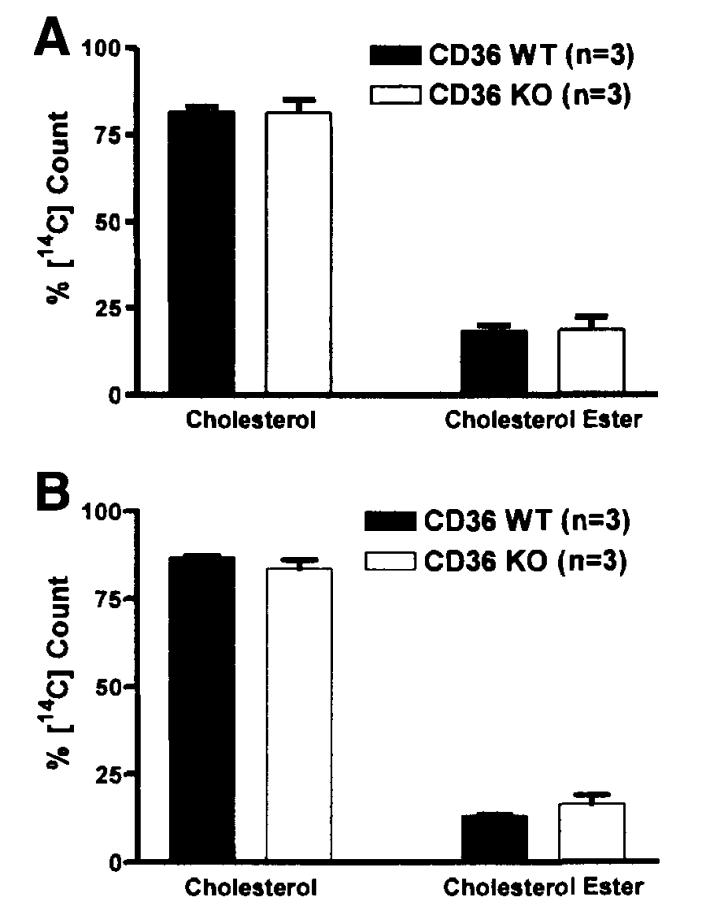
Figure 6.
Thin-layer chromatography analysis of [14C]-labeled lipid fraction of the small intestine. Mice were equipped with lymph and duodenal cannulas, and were intraduodenally infused with a lipid emulsion containing labeled TG (the label was on all FA molecules of the TG) and cholesterol for a period of 6 hours. At the end of the study, the small intestines were divided into 4 equal segments. Only the analysis of the first 2 (most proximal) segments was shown here: (A) M1 and (B) M2. Extracted lipid fraction was separated by thin-layer chromatography into cholesterol and CE. No statistical significance was found between the WT and KO. Values are means ± SE.

