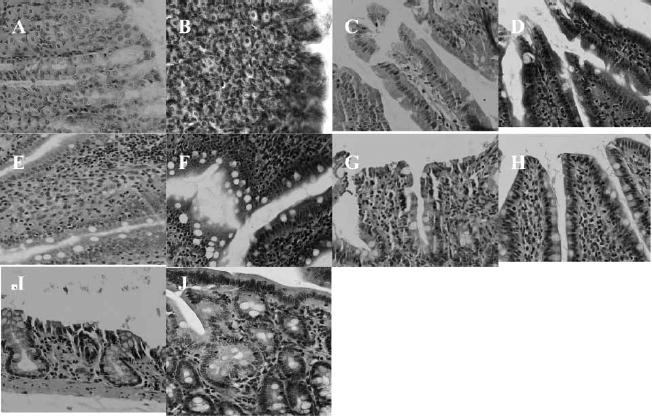
Figure 4.

H&E photomicrographs of gastric and intestinal tissue sections after oral administration of AT1002 (100 μg/kg and ardeparin 1200 IU/kg). All panels represent cross-sections of gastric and intestinal tissues. The original magnification was 100 × for all panels. (A) stomach (control); (B) stomach (test); (C) duodenum (control); (D) duodenum (test); (E) jejunum (control); (F) jejunum (test); (G) ileum (control); (H) ileum (test); (I) colon (control); (J) colon (test).
