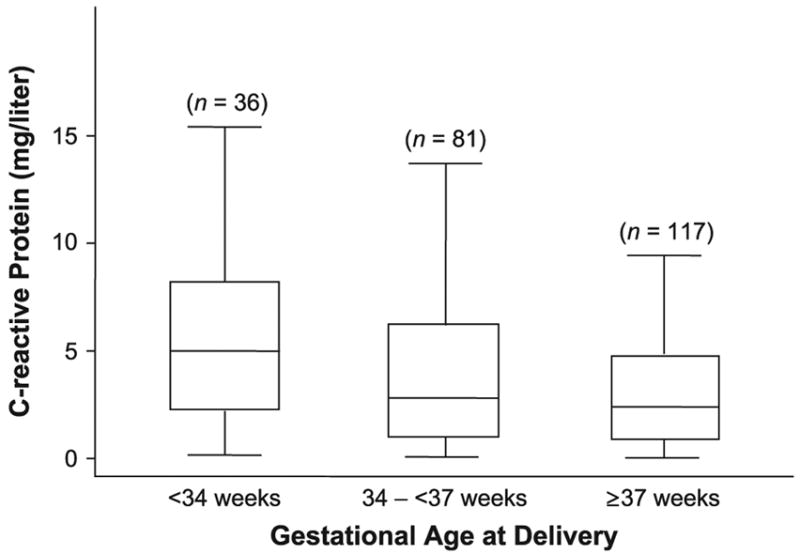
FIGURE 1.

Distribution of C-reactive protein according to gestational age at delivery, Project Viva, Massachusetts, 1999–2003. The boxes represent the interquartile range; the lower edge and upper edge correspond to the 25th and 75th percentiles, respectively. The horizontal line in each box represents the median level of C-reactive protein in each group. The extreme values within 1.5 times the interquartile range from the upper or lower quartile are the ends of the lines extending from the boxes.
