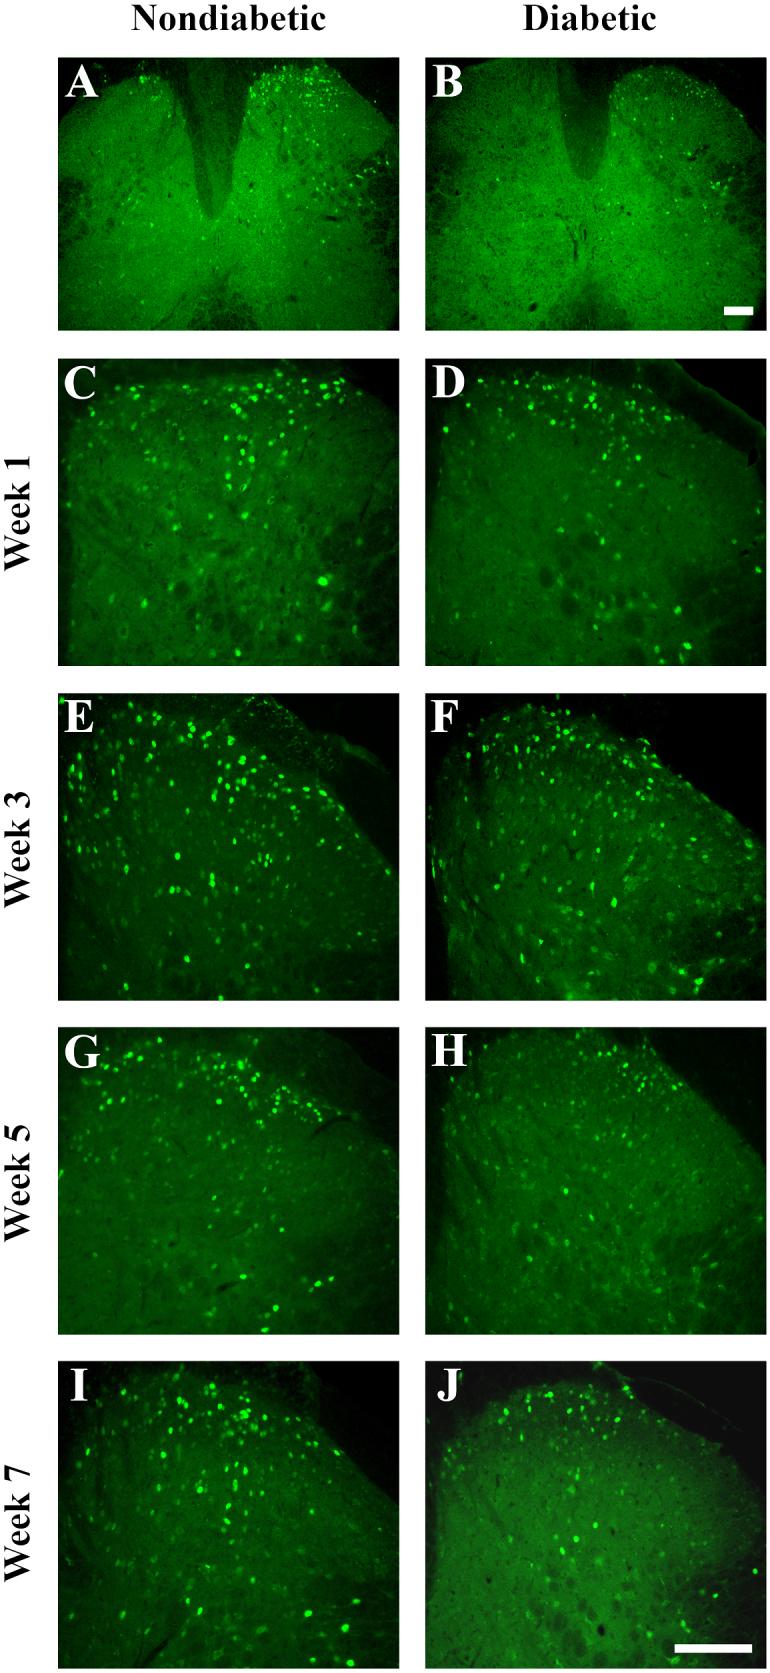
Figure 2. Formalin-induced expression of Fos in the mouse lumbar spinal cord.

Representative images at low magnification (A, B) and high magnification (C-J) of Fos-positive neurons in the lumbar spinal cord after formalin injection. A, B) Formalin-induced Fos expression was apparent predominantly on the ipsilateral side to the formalin injection in both nondiabetic and diabetic mice, albeit in fewer neurons in diabetic mice. Images were taken from mice 7 weeks post-STZ. C-J) Comparisons of Fos-positive neurons were made between nondiabetic (left side) and diabetic (right side) mice. Fos expression appeared relatively normal in diabetic animals at weeks 1 (C, D) and 3 (E, F) post-STZ. However, Fos expression was visibly decreased in diabetic mice at 5 (G, H) and 7 (I, J) weeks. Scale bar, 100 μm for each image.
