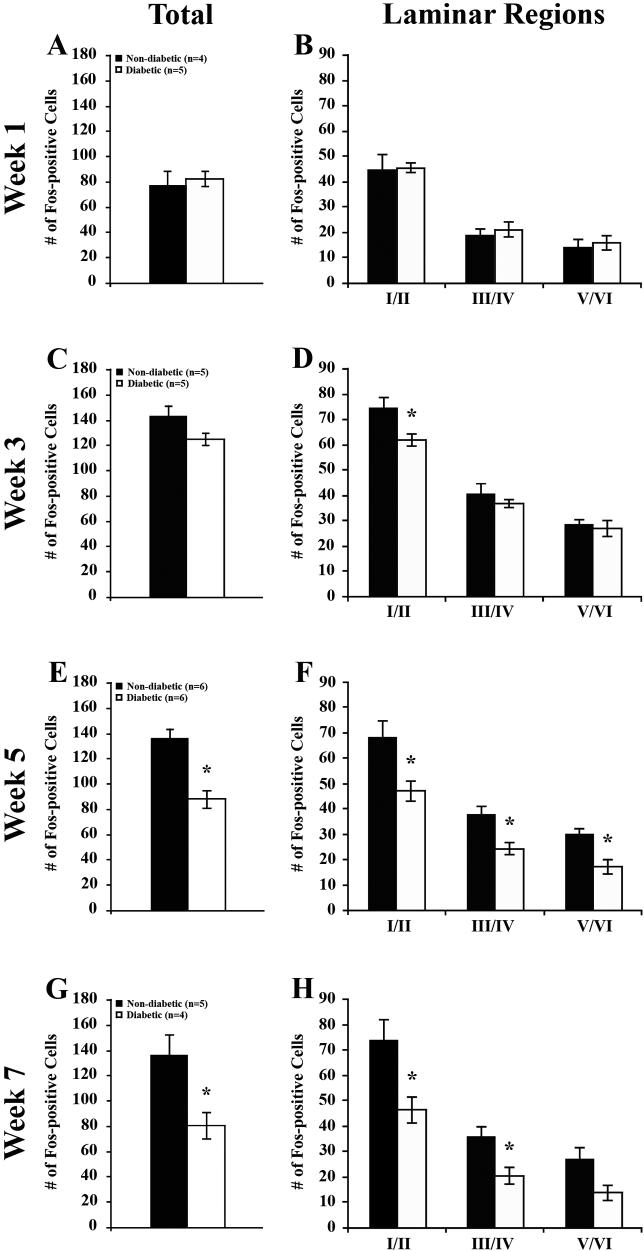
Figure 3. Quantification of formalin-induced Fos expression in diabetic mice.
A, C, E, G) Quantification of total Fos expression in the dorsal horn of nondiabetic and diabetic mice. Comparisons between nondiabetic and diabetic mice revealed a significant decrease in Fos-positive neurons at weeks 5 and 7.
B, D, F, H) Quantification of Fos expression within laminar regions. B) One week post-STZ, an analysis of Fos-positive neurons within specific laminar regions revealed no significant differences between nondiabetic and diabetic animals. C) In contrast, analysis at 3 weeks post-STZ revealed a significant reduction in Fos-positive neurons within laminae I/II in diabetic versus nondiabetic mice. D) More severe reductions in Fos-positive neurons in diabetic mice were evident at 5 (D) and 7 (E) weeks post-STZ in all laminae, with the exception of laminae V/VI at 7 weeks. Data plotted as means +/− standard error of mean. * P < 0.05 vs nondiabetic mice.

