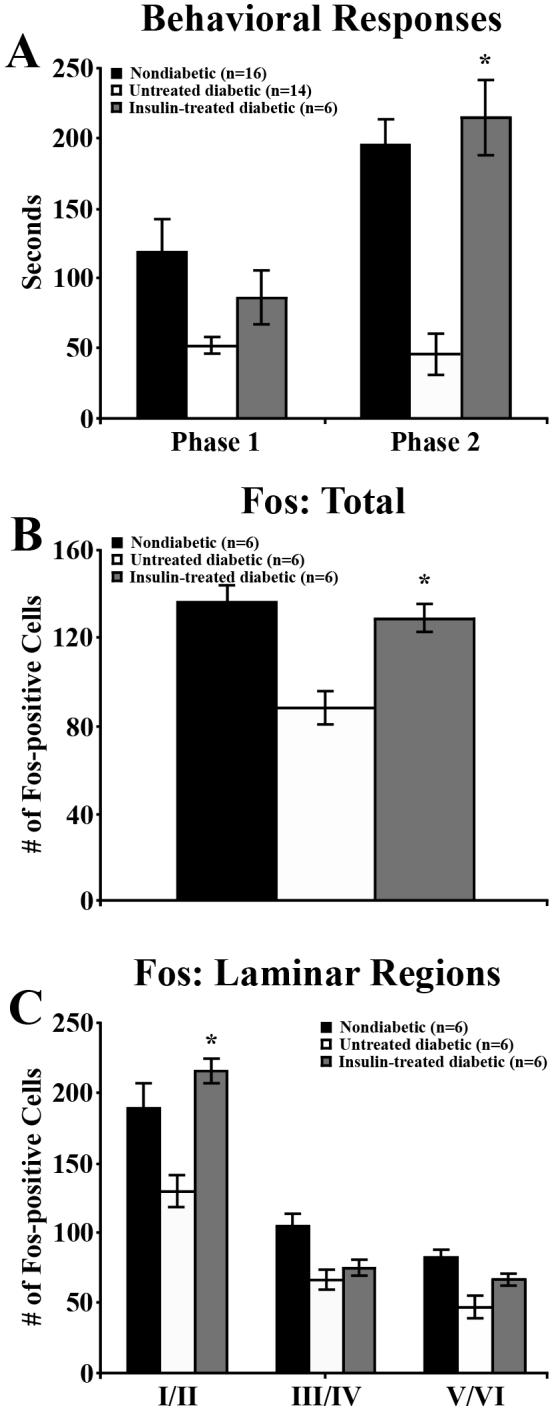
Figure 4. Insulin increases formalin-induced pain responses and spinal Fos expression.

The behavioral responses (A) and Fos expression (B, C) of nondiabetic, untreated diabetic, and insulin-treated diabetic mice following formalin injection at 5 weeks post-STZ. Nondiabetic and untreated diabetic groups are the same mice used in Figure 3 E, F. A) During Phase 1, behavioral responses of insulin-treated diabetic animals were not significantly higher than in untreated diabetic animals. During Phase 2 of the formalin test, insulin-treated diabetic mice devoted significantly more time to the injected foot than untreated diabetic mice and did not perform significantly different from nondiabetic mice. B) Insulin-treated diabetic mice also had significantly greater total numbers of Fos-positive dorsal horn neurons per spinal cord section than untreated diabetic mice and were not significantly different from nondiabetic mice (P = 0.4901). C) Insulin significantly increased the number of Fos-positive neurons per section in laminae I/II compared to untreated diabetic mice. Data plotted as means +/− standard error of mean. * P < 0.05 vs untreated diabetic mice, # P < 0.0001 vs untreated diabetic mice.
