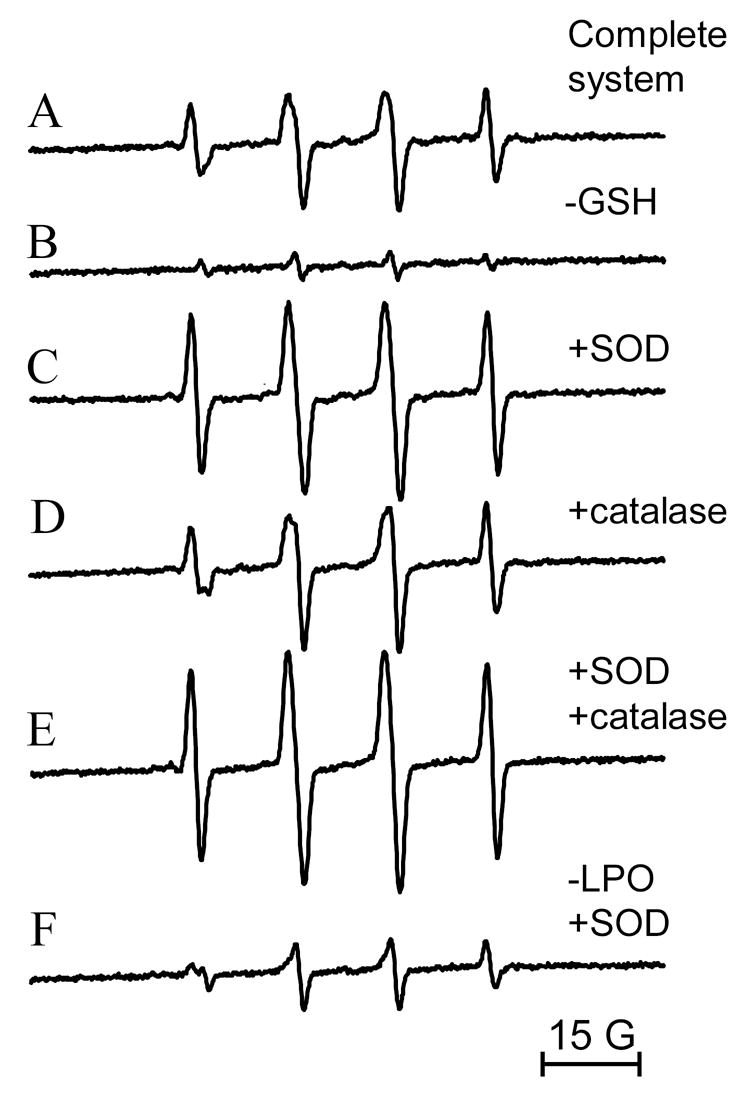
Fig. 2.

EPR spectra of lactoperoxidase (2.5 μM) incubations with GSH (2.5 mM) in the presence of DMPO (100 mM). (A) No further additions; (B) in the absence of GSH; (C) in the presence of GSH and Cu, Zn-SOD (10 μM); (D) in the presence of GSH and catalase (650 U/ml); (E) in the presence of GSH, Cu, Zn-SOD and catalase; (F) in the absence of LPO and in the presence of Cu, Zn-SOD (10 μM). Instrumental conditions were modulation frequency, 100 kHz; modulation amplitude, 1 G; microwave power, 20 mW; receiver gain, 6 × 10⁴; time constant, 164 ms; conversion time, 164 ms; total scan time 168 s.
