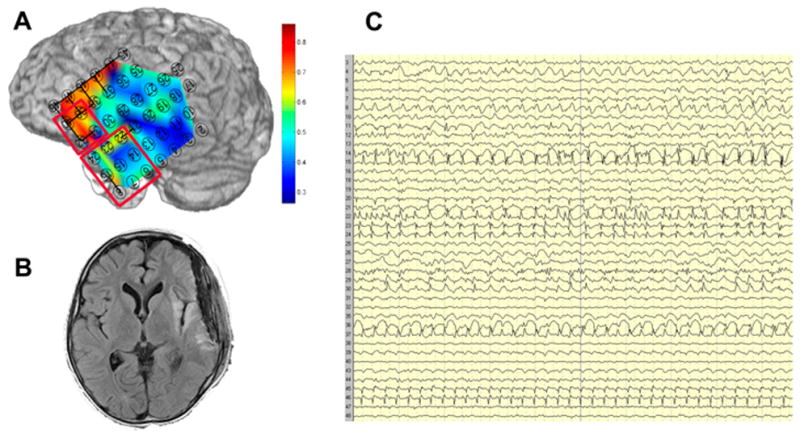
Figure 4.

Spatial variation in local 5-minute average MPC in Patient 3, a 9 year old with Parry-Romberg syndrome and a left peri-insular lesion in prolonged focal status epilepticus. a) Marked local hypersynchrony in the inferior frontal region as compared to the lateral temporal region. The frontal and temporal resections are shown in red outline. b) T2-weighted image showing the perisylvian lesion. c) Intracranial EEG showing typical ictal activity broadly distributed across the left fronto-temporal grid. Compared to the synchrony map, the differences between the frontal and temporal regions are difficult to appreciate on visual inspection.
