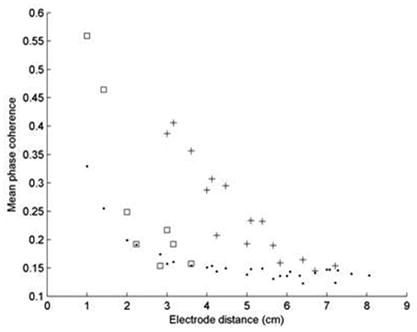
Figure 6.

Plots of the 5-minute average MPC vs. interelectrode distance for Patient 1. Solid dots denote channel pairs for which both electrodes were outside of LH areas. Squares denote electrode pairs belonging to a single LH region, while crosses denote electrode pairs located in noncontiguous LH regions. Note that local synchrony values are represented by the data at x = 1. The data show that LH electrode pairs nearly always had higher synchrony values than non-LH pairs regardless of the distance between them; the synchrony between the two LH regions (shown in Figure 2) is especially prominent.
