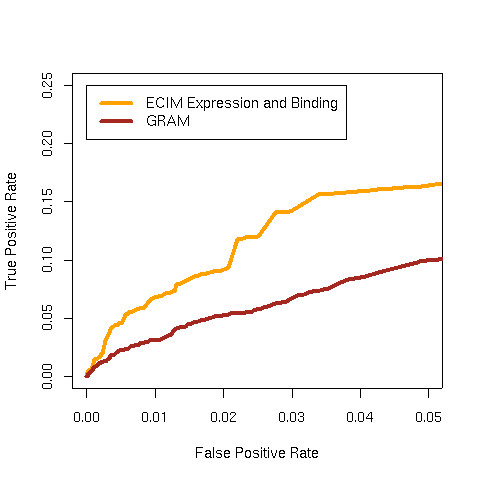
Figure 5.

ROC curves comparing the functional coherence of TMs constructed by GRAM and ECIM using the combined sporulation and cell-cycle gene expression dataset and the ChIP-chip data of Lee, 2002 with Gene Ontologies as gold standard.

ROC curves comparing the functional coherence of TMs constructed by GRAM and ECIM using the combined sporulation and cell-cycle gene expression dataset and the ChIP-chip data of Lee, 2002 with Gene Ontologies as gold standard.