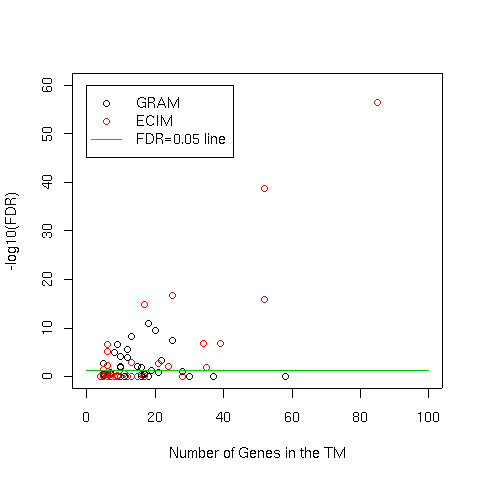
Figure 6.

The distribution of TM sizes vs -log10 of FDR-adjusted p-values calculated by Fisher's test for association between the membership in a TM and the most significantly over-represented Gene Ontology. The green line represents the statistically significant cut-off of FDR<0.05. All points above the line represent statistically significant associations.
