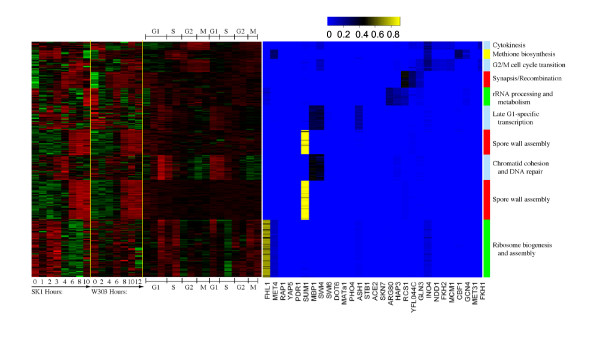
Figure 7.
Heatmap of expression data and PBPs for highly specific TMs inferred by ECIM algorithm using the combined sporulation and cell-cycle gene expression dataset and Lee's ChIP-chip data. Each line in the heatmap represents a gene. Red-green heatmap represents gene expression levels in the three different gene expression datasets that were combined together in this analysis and each column represents one microarray. The yellow-blue heatmap represents Posterior Binding Probabilities for 29 most significant TFs with each column in the heatmap representing a TF. Colour-bar on the right of the heatmap depicts groupings of co-regulated genes into TMs and is denoted with the significantly correlated functional category.

