FIG. 7.

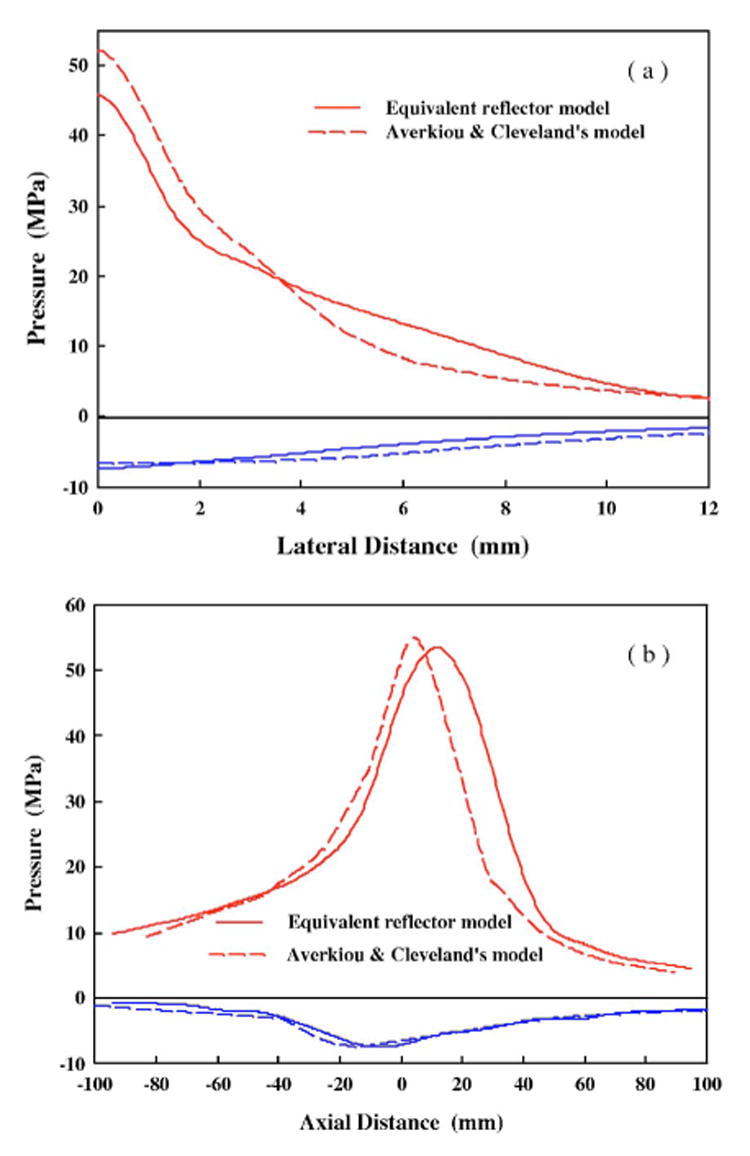
The simulated peak pressure distributions (a) transverse to and (b) along the lithotripter axis. The solid lines are the results of the equivalent reflector model and the dashed ones are those of the AC model.

The simulated peak pressure distributions (a) transverse to and (b) along the lithotripter axis. The solid lines are the results of the equivalent reflector model and the dashed ones are those of the AC model.