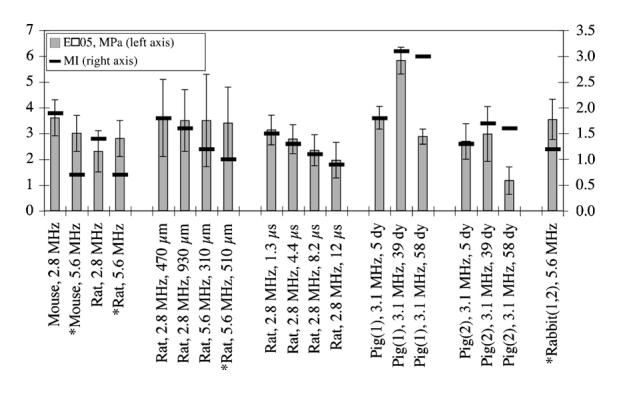
Fig. 21.

Summary of ED05 (5%) lesion occurrence thresholds in terms of pr(in situ) (MPa) (bars; left axis) and MI (lines, right axis). *denotes the studies that are evaluated under the same exposure conditions. Error bars are SEMs. These data, by groupings from left to right, are derived, respectively, from Zachary et al. (2001a) and O'Brien et al. (2001, 2003a, b, 2006).
