
FIGURE 4. PRESSURE STABILITY OF HRV14.
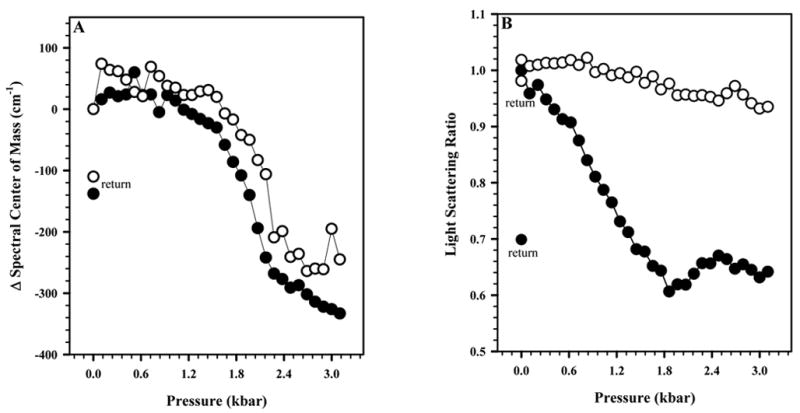
The effect of pressure on HRV14 measured in the absence (●) and presence (○) of WIN 52084 (10 μg/mL) at 25°C. The virus concentration was 50 μg/mL. In A, this effect was measured by the spectral center of mass of tryptophan fluorescence emission. In B, this effect was measured by light scattering. The measured values of center of mass and light scattering after release of pressure are labeled as “return” symbols. Other conditions as in Figure 2. Data points represent the average of three independent measurements.