
FIGURE 7. COLD DISSOCIATION OF HRV14 UNDER PRESSURE.
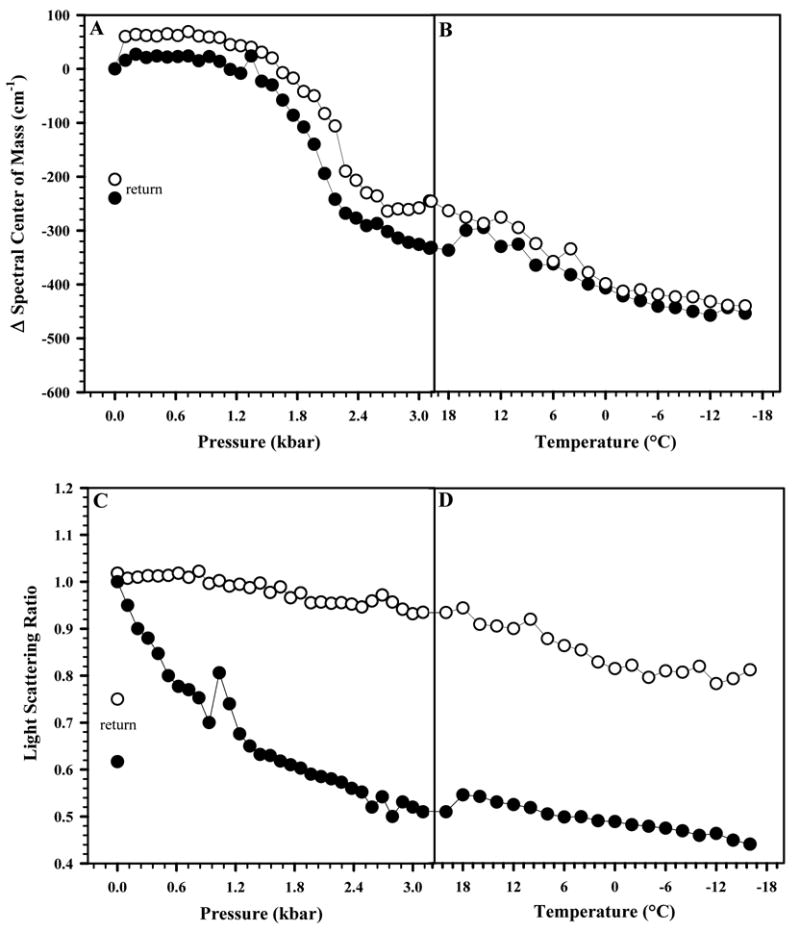
The effect of pressure combined with subzero temperatures on HRV14 was measured in the absence (●) and presence (○) of WIN 52084 (10 μg/mL). The virus concentration was 50 μg/mL. In A, changes in the tertiary structure were measured by the spectral center of mass of tryptophan fluorescence emission. In B, dissociation was measured by light scattering. Pressure was increased from 0.001 to 3.2 kbar at 25°C, and then temperature was lowered to –16°C. The measured values of center of mass and light scattering after release of pressure are labeled as “return” symbols. Data points represent the average of three independent measurements.