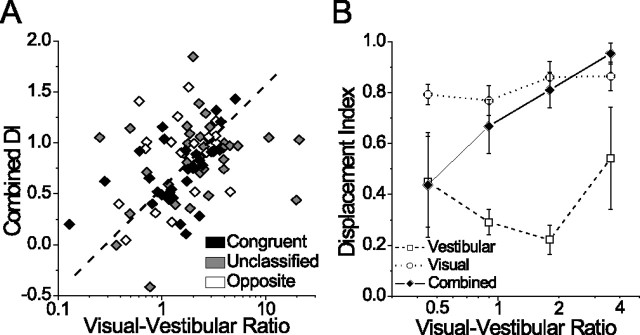
Figure 7.
Relationship between the DI and VVR. A, Combined DI plotted against VVR for all cells with significant tuning in the combined condition (n = 103). Here, the dashed diagonal line is a best-fit line (linear regression with two dependent variables: combined DI and log-transformed VVR). B, Summary of DI vs VVR for the three stimulus conditions, using log-spaced binned averages. Error bars indicate SEM. Extreme values of VVR >5.5 (n = 3) and <0.3 (n = 3) were excluded from the graph for clarity.

