
Figure 3. Effect of shear on cadherin-cadherin association.
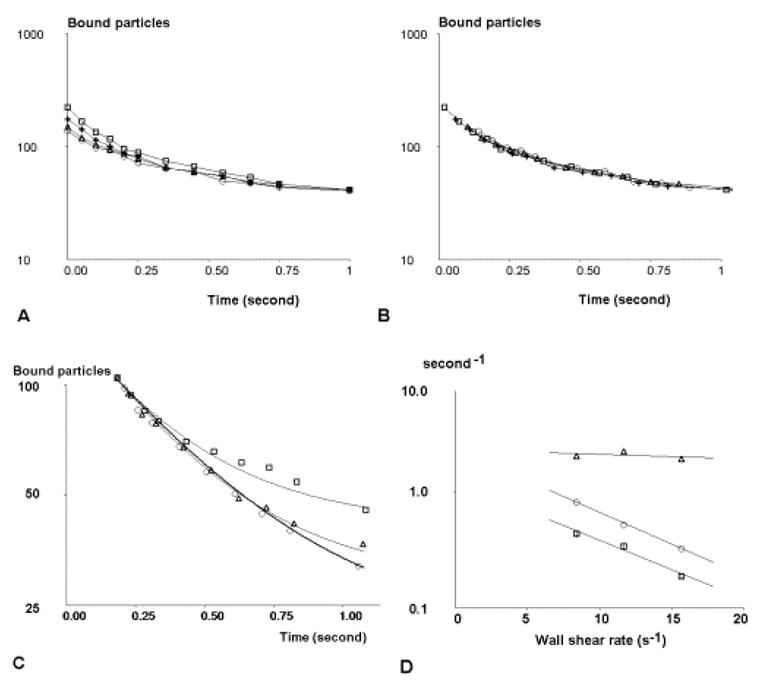
a, b: Comparison of unbinding plots obtained in the same series of experiments with (b) and without (a) correcting apparent arrest durations as described. Threshold time for arrest duration was 80 ms (squares), 120 ms (crosses), 160 ms (triangles) or 200 ms (circles). c: Normalized graphs of bound particles versus time are shown for a wall shear rate G of 8.4 s−1 (squares), 11.7 s−1 (triangles) and 15.7 s−1 (circles). Fitted theoretical curves ares shown as thin continuous (G = 8.4 and 11.7) or thick (G = 15.7 s−1) lines. d: the effect of wall shear rate G on binding frequency f (squares), koff (triangles) and kt (circles) is shown. The equation of the regression line for binding frequency is: lnf = − 0.118 G + 0.235. Vertical bar length is twice standard error. The regression line for kt is ln kt = − 0.127 G + 0.868.