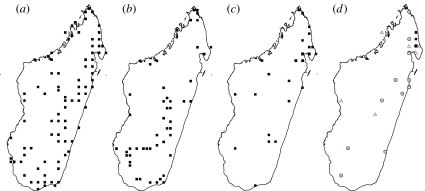
Figure 1.
Maps showing (a) the historical sampling localities during 1875–1990, (b) our sampling localities during 2002–2006, (c) the sampling localities of 21 apparently extinct species apart from H. undatus and (d) the localities for H. undatus prior to 1900 (grey circles), during 1901–1950 (open triangles) and during 1951–1973 (black squares). Localities are mostly shown with resolution of 0.5°.

