
Fig. 3.
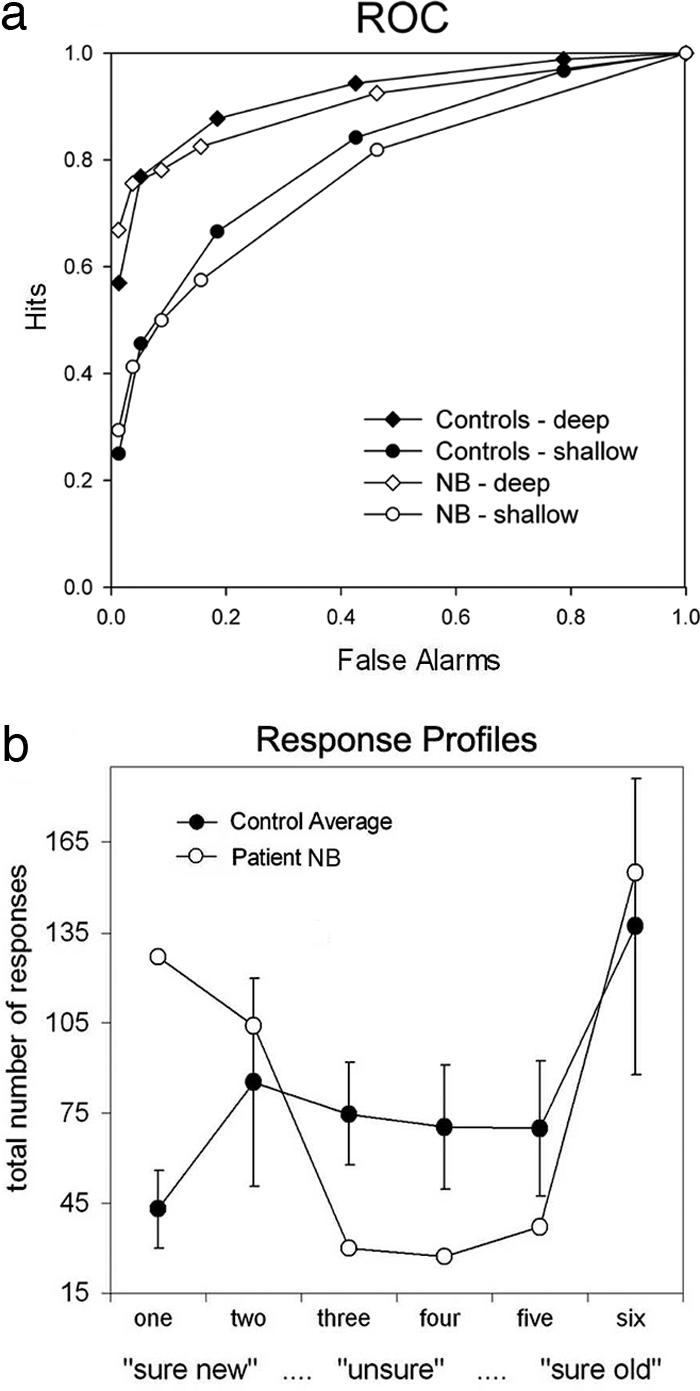
ROC data in Experiment 3 for two different encoding conditions. Data are shown for NB as compared with the mean of control participants. (a) ROC curves. Note that NB's curve is more assymetric and linear than that of controls for both encoding conditions. (b) Number of total responses given for the different levels of confidence. Consistent with the idea that NB's recognition operates in an all-or-none manner, she uses the low-confidence options (“3”, “4”) less frequently than controls. Error bars represent standard deviations for control participants.