
FIGURE 5.
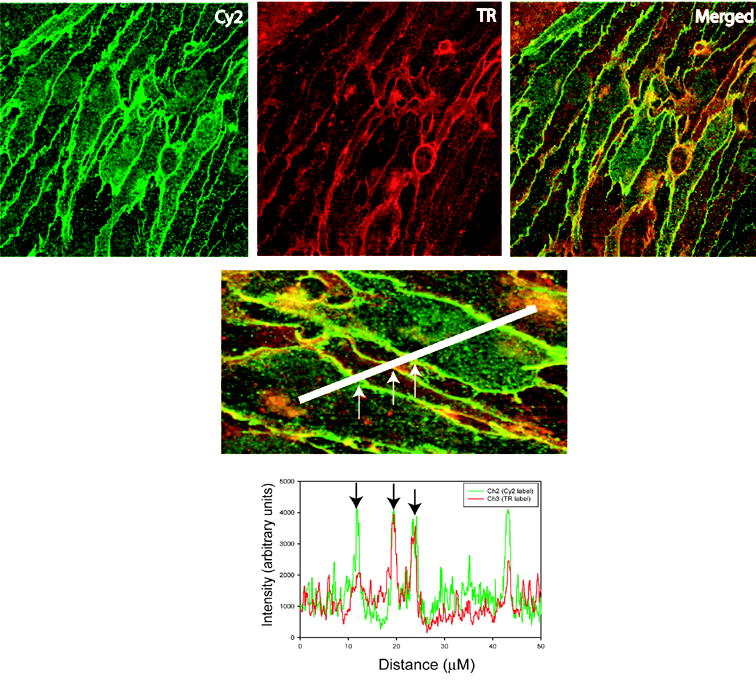
Analysis of confocal microscopy images. Representative confocal image is shown. bEnd3 cells were stained with antibody to claudin-5 (Cy2 panel) and wheat germ agglutinin (TR panel). The merged panel shows the overlap between claudin-5 immunoreactivity and wheat germ agglutinin incorporation in yellow. Lower panel shows how cells were sampled using a linescan measurement and generation of intensity histograms. Immunofluorescent intensities for membrane localizations were taken by averaging 2–5 μm of the linescan where overlap of the Cy2 and TR signals occurred, as shown in the histogram (arrows). Cytoplasmic intensities were taken from 2–5 μm regions with lowest TR signal, indicating the interior of the cell.