
Figure 1.
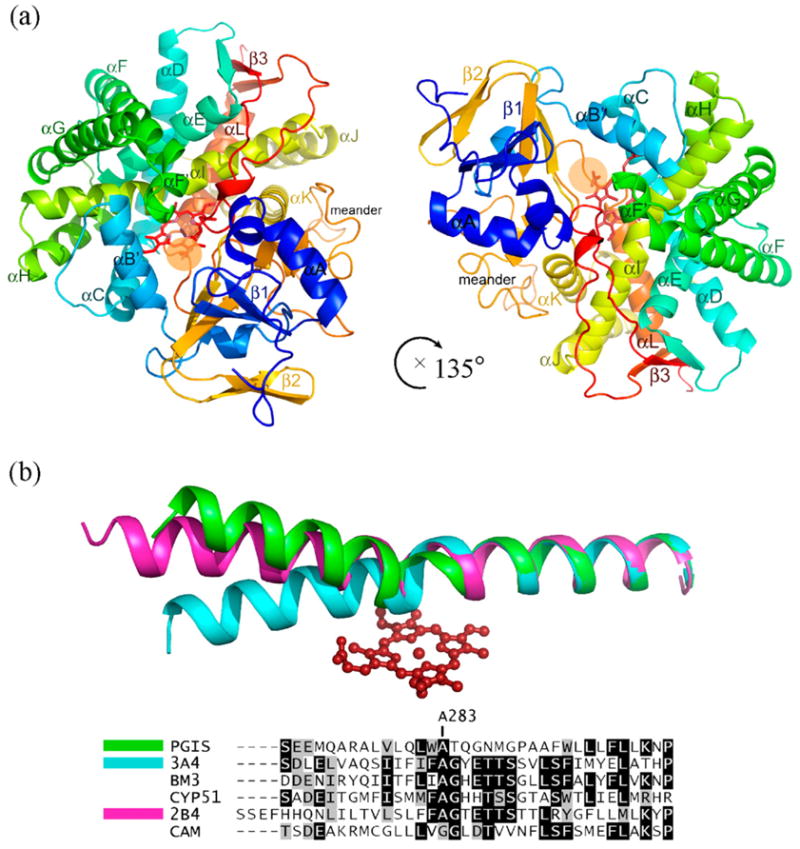
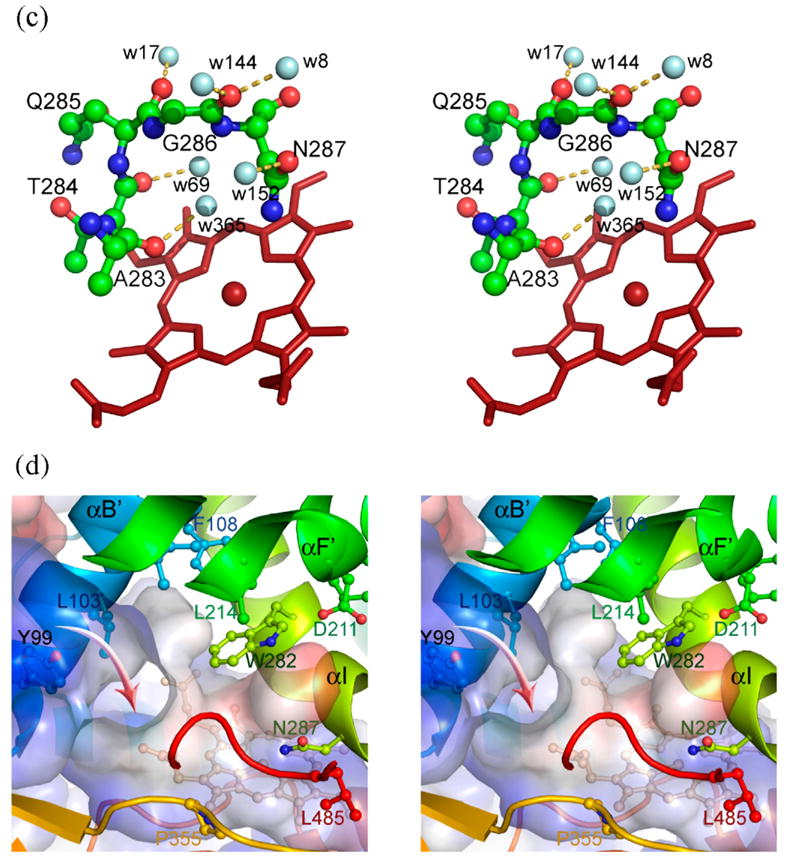
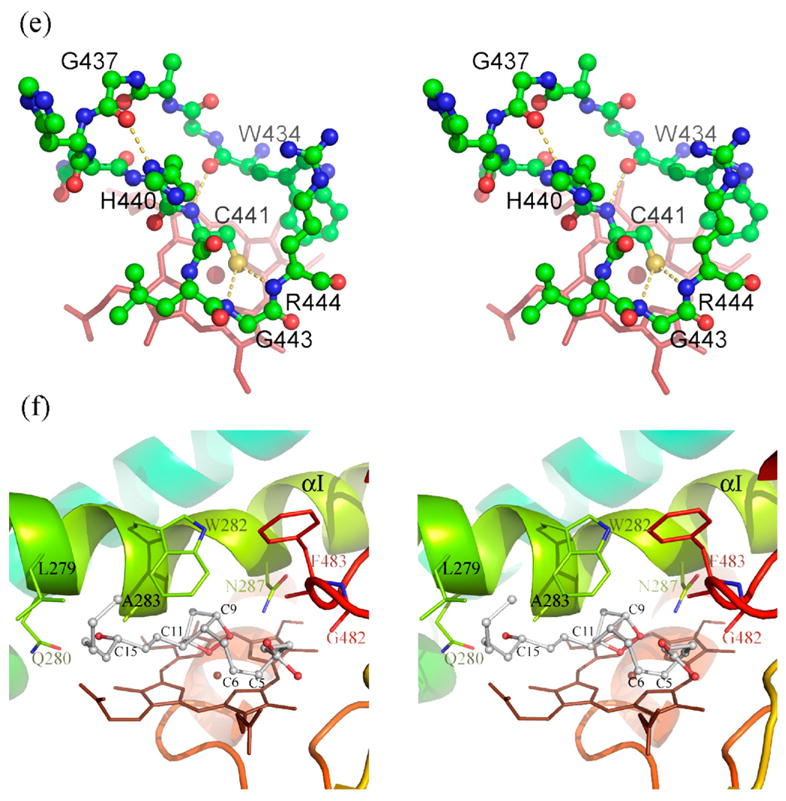
Structure of human prostacyclin synthase. (a) Ribbon representation of PGIS viewed from substrate entrance channel (beige circle). The structure is rainbow-colored with the N terminus in blue and the C terminus in red. The heme is shown as a stick model in the center of the molecule. Major helices and β sheets are labeled. (b) Structural overlay (top panel) and sequence alignment (bottom panel) of the I helix in known P450 structures. Each structure was superimposed pairwise with PGIS at the C-terminal half. The highly conserved alanine residue is indicated in accordance with PGIS sequence. Black-shaded or gray-shaded residues in the bottom panel correspond to those that share more than 50% of identity or similarity, respectively. (c) Stereoview of the central I helix region of PGIS. The color coding is: oxygen, red; nitrogen, blue; carbon, green. Water molecules are depicted as cyan spheres. H-bonds are shown as broken lines. (d) Stereoview of the substrate-binding channel and active-site chamber of PGIS. The coloring scheme is the same as that in (a). Structural elements and a part of residues constituting the active site are indicated. The solvent-accessible molecular surface is shown as a semitransparent envelope in cyan. The curved arrow indicates the entrance of the substrate-binding channel. (e) Stereoview of the PGIS cysteine ligand loop. Residues are shown. The color coding is the same as that in (c) and broken lines indicate H-bonds. (f) Stereoview of the substrate-binding model. PGH2 is depicted in ball and stick; the carbon atoms are shown in gray and oxygen atoms are in red. The numberings of key carbon atoms in PGH2 are also indicated. The Figure was generated using PyMol [http://www.pymol.org].