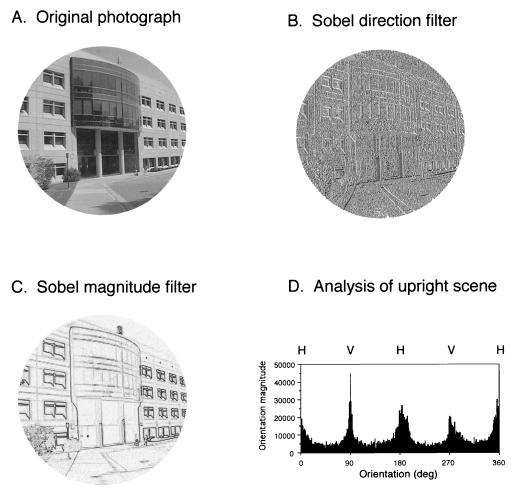
Figure 1.
Analysis of oriented contours in real-world scenes. (A) Digital photograph of the Neurobiology Building and its immediate surroundings at Duke University. (B) Image in A after the application of a Sobel direction filter. (C) Image in A after the application of a Sobel magnitude filter. (D) Plot of the summed pixel magnitudes, grouped by orientation. The peaks and troughs evident in the plot provide a quantitative measure of the predominance of projected contours near the vertical (V; 0/270°) and horizontal (H; 0/180°) axes in such scenes. A full 360° are shown because white to black transitions occupy half of the gray-scale, and black to white transitions occupy the other half.

