
Figure 4.
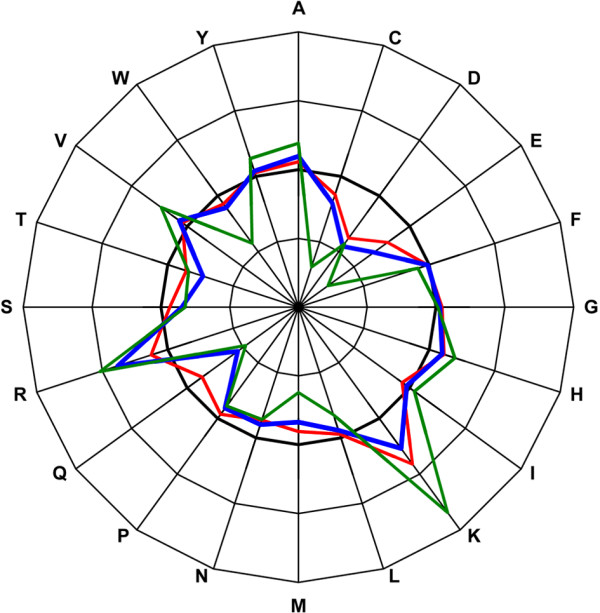
Changes in mutations to residue charges. Average changes in mutations to residue charges in α-helices (red), β-strands (blue), turns and bends (green). The thick line indicates the original amino acid charges. Outer rings indicate higher charge values and inner rings lower, in steps of 1.25 pI.