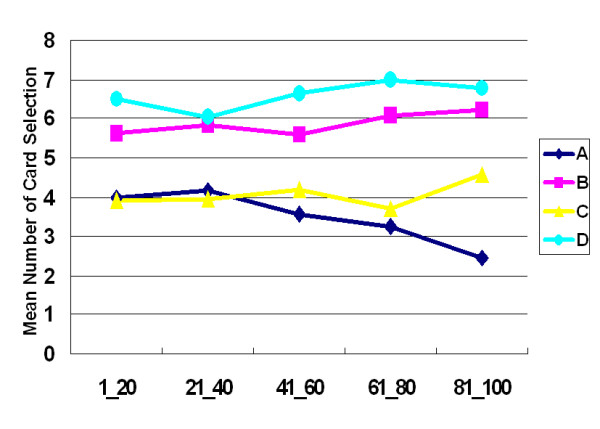
Figure 4.

Mean number of cards selected in blocks during stage 2. The learning curve in stage 2 also replicated the findings from stage 1, with decks A and C exhibiting lower preference than decks B and D. Unexpectedly, participants preferred the high-frequency gain-decks (B, D) to the other two decks (A, C) even during the second encounter of IGT.
