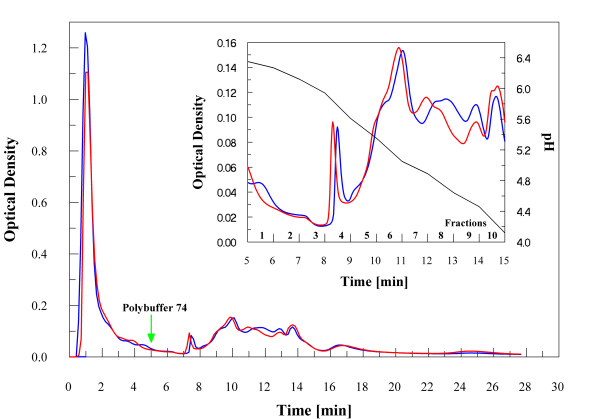
Figure 2.
Chromatofocusing fractionation. Profile of the chromatofocusing in the range pH 6–4 of the protein extract (10 mg/mL) from control [blue line] and cells perturbed with 100 μM nickel sulphate [red line]. A green arrow at 5 min indicates start of elution with polybuffer 74. In the insert is shown the zoomed region of the chromatogram from 5 to 15 min corresponding to the pH elution and fractions analysed by RP-HPLC.

