
FIG. 1.
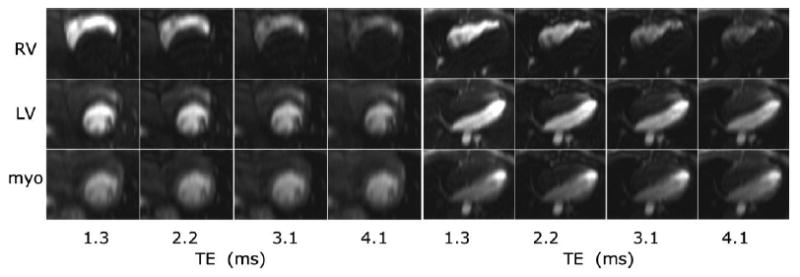
Multiecho images for short-axis (left) and four-chamber (right) views at the time of peak RV enhancement (top row), peak LV enhancement (middle row), and peak myocardial enhancement (bottom row) for TE = 1.3, 2.2, 3.1, and 4.1 ms (left to right). Note the decrease in blood pool signal intensity at longer TE for peak RV and LV enhancement due to the high Gd concentrations of the bolus.