FIG. 8.

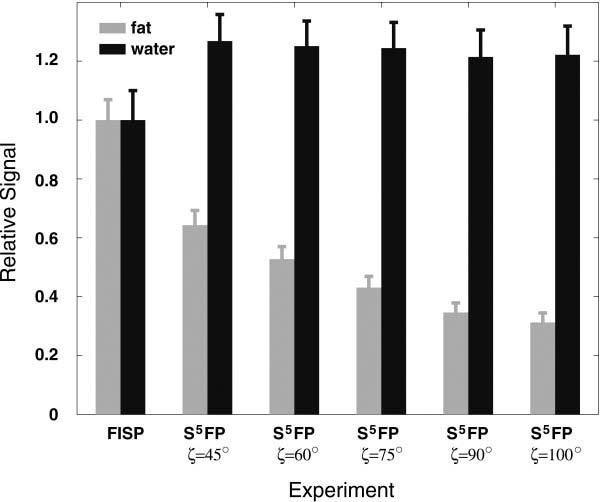
Comparison of signal levels from ROIs in the calf images displayed in Fig. 7, comprising fat and water based tissue types acquired using conventional FISP and S5FP pulse sequences for various values of water-fat separation angle, ζ.

Comparison of signal levels from ROIs in the calf images displayed in Fig. 7, comprising fat and water based tissue types acquired using conventional FISP and S5FP pulse sequences for various values of water-fat separation angle, ζ.