
Fig. 2.
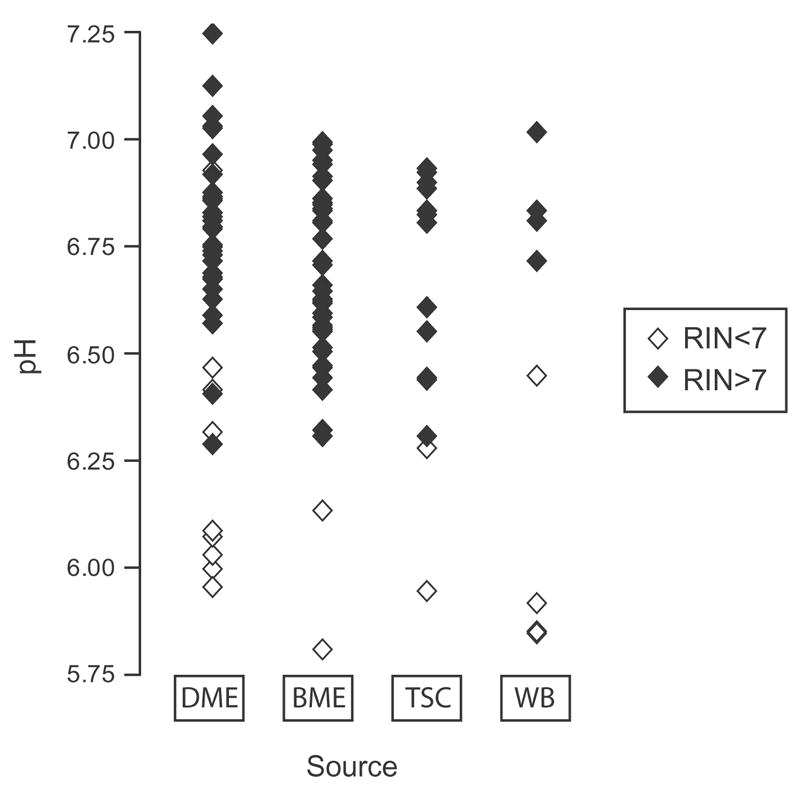
Scatterplot diagram of the pH distribution of all cases grouped by the source of tissue. Within every group, the cases with low RIN (RIN<7) are plotted in open diamonds and the cases with high RIN (RIN>7) are plotted in filled diamonds.
Official websites use .gov
A
.gov website belongs to an official
government organization in the United States.
Secure .gov websites use HTTPS
A lock (
) or https:// means you've safely
connected to the .gov website. Share sensitive
information only on official, secure websites.
Scatterplot diagram of the pH distribution of all cases grouped by the source of tissue. Within every group, the cases with low RIN (RIN<7) are plotted in open diamonds and the cases with high RIN (RIN>7) are plotted in filled diamonds.