
Fig. 4.
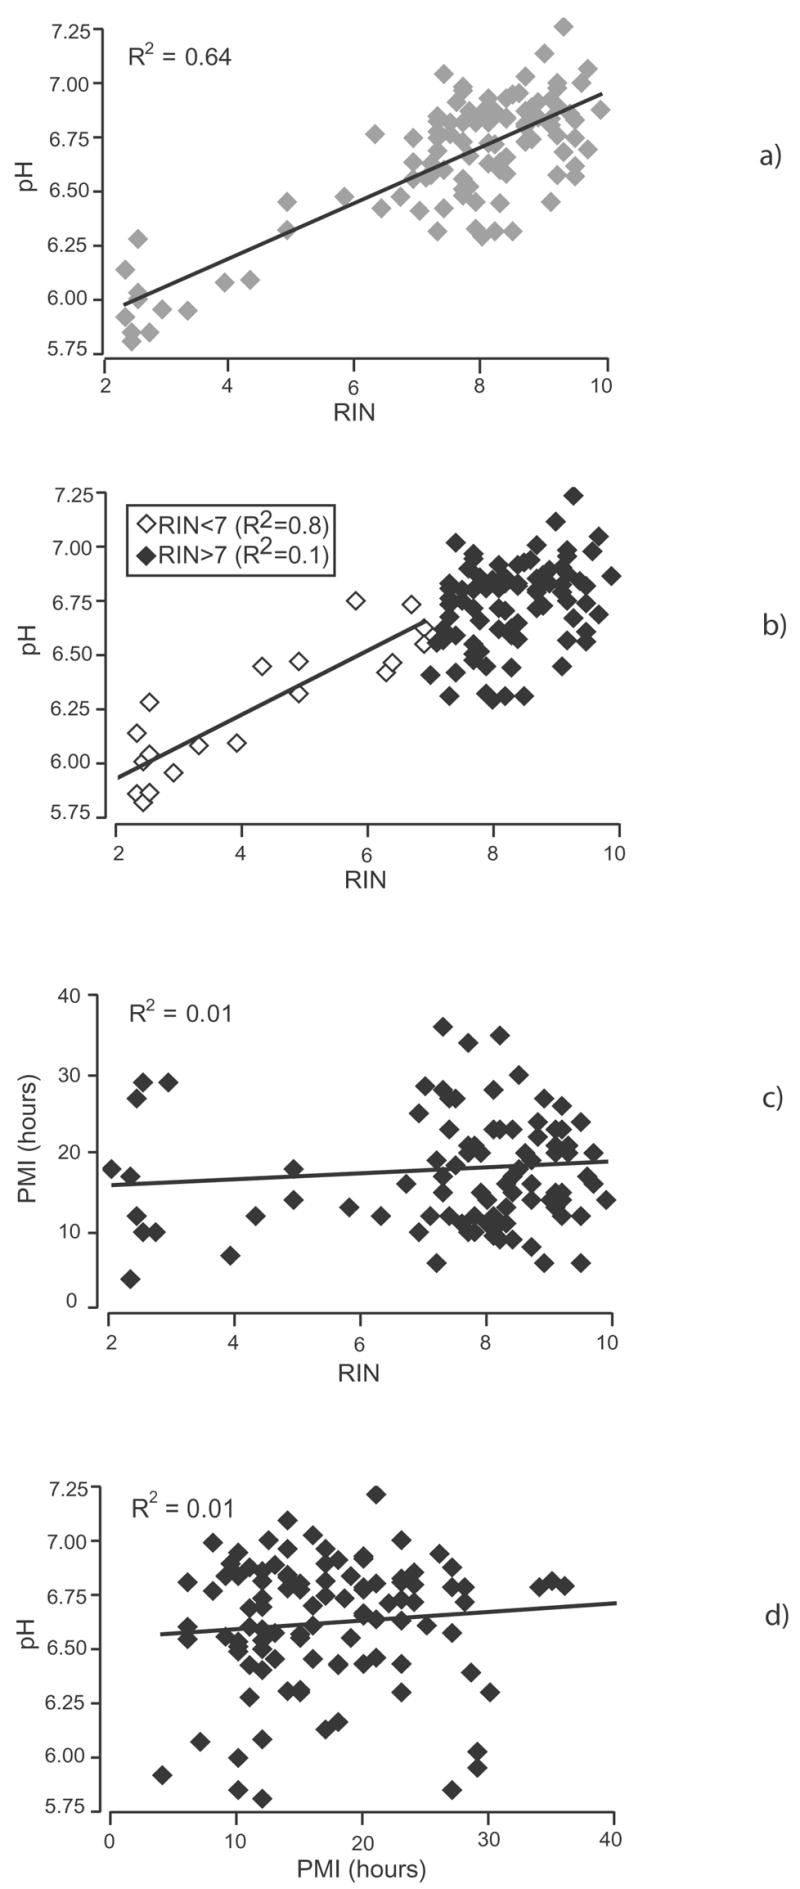
Correlations between different quality parameters: (a) pH and RIN. At low RIN values (RIN<7; white diamonds), there is a strong correlation between pH and RIN (R2=0.8). No correlation develops at high RIN values (RIN>7; black diamonds). The correlation bar is shown only for the low RIN value range; (b) pH and RIN. There is a good overall correlation between pH ands RIN (R2=0.6) (c) PMI and RIN. No significant correlation exists (R2=0.01); (d) pH and PMI. No significant correlation exists (R2=0.01).